"Deep Winter" and "Spring Light": Where Is the Path Forward for Enterprise Software in 2023? | Enterprise Software Notes

A Deep Dive into the China-US Software Markets

➤➤➤ Software has undoubtedly been one of the hottest sectors in recent years.
2021 was a record-breaking year for the software industry. Driven by interest rate cuts and the shift to remote work, software IPOs and valuations surged, with median valuation multiples reaching 16x revenue. However, inflation, rising interest rates, and geopolitical uncertainty triggered a major market correction in 2022. Numerous software companies saw significant market cap declines, noise proliferated across primary and secondary markets at home and abroad, unlisted companies entered a funding winter, and both enterprises and investors faced mounting pressures.
So in 2023, does software investment still hold opportunity? Where? How should software companies be reasonably valued? Which software subsectors can grow against the headwinds? Yunqi Capital's enterprise software team examines both US-listed and A-share software, studying their valuations, performance, and data profiles — offering reference points for primary market investors and perspectives for founders. (Tip: this issue is packed with hardcore insights; interested readers should definitely read to the end~)
Yunqi Capital remains focused on "technology innovation, industrial empowerment." Enterprise services is one of our sustained investment priorities, including domestic substitution of foundational software, IT application innovation (Xinchuang), decision intelligence, and security compliance. We've made early investments in outstanding companies such as PingCAP, Coohom, XTransfer, Sobot, DeFeng Technology, IceKredit, Cool College, ZhenZero Technology, Penglai Data, Bailing Intelligence, Xiaoyang Education, Tiangfu Software, Biling Technology, and Heguang Shujuan.
This article is excerpted from Yunqi Capital's enterprise software report, structured as follows:
1. Navigating volatility while envisioning the future: what valuation logic is needed?
- Overview of US software valuation and future expectations
- Overview of A-share market valuation
2. Value and pathways: what kind of software demonstrates resilience?
- The "AEPEC" five-dimensional model (by value proposition)
- Three key performance indicators
3. The listing decision: A-shares or US stocks?
- Listing venue selection and business model
- The digital transformation wave hasn't stopped; software's future remains promising

Envisioning the Future Amid Volatility,
What Valuation Logic Is Needed?
Unlike the early pandemic period when software benefited from remote work tailwinds, the effects of macroeconomic downturn and aggregate demand contraction have gradually transmitted to the software sector. The industry has entered a cooling-off period. In this environment, how should primary market investors value software companies? What might valuations look like over the next two years?
To properly value software companies, we need to understand the historical valuation patterns of both US and A-share markets.
**➤ **Overview of US Software Valuation and Future Expectations
First, let's examine the overall US software valuation landscape and expected trajectory. Revenue multiple is the commonly used valuation metric for software in US equity markets.
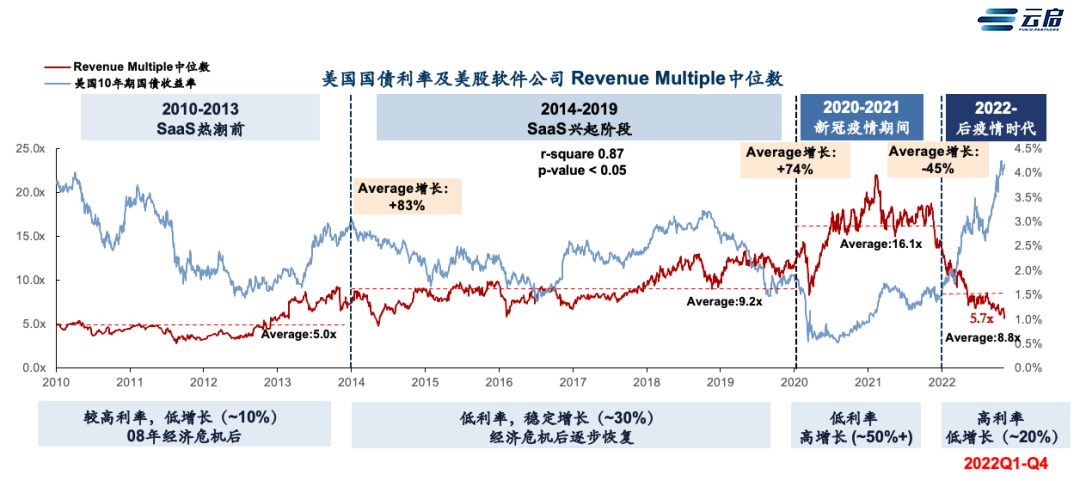
Dividing the timeline into pre-software boom, software rise, COVID-19 pandemic, and post-pandemic eras, we can see that the median revenue multiple for US software companies is negatively correlated with 10-year Treasury yields. According to Morgan Stanley's regression analysis, a 1% increase in the 10-year Treasury yield corresponds to a 15% decline in revenue multiples.
During the pandemic, fueled by US rate cuts (Treasury yield at 1.168%) and remote collaboration trends, US software stocks surged. Average revenue multiples increased 74% to reach 16.1x. This year, the average revenue multiple stands at 8.8x, down 45% from pandemic peaks and roughly flat with 2019 levels.
From 2022 to present, the US 10-year Treasury yield has averaged 2.81%, up 0.50 percentage points from the 2.31% seen in 2014-2019. Based on regression calculations, revenue multiples during this period should be 7.5% lower than 2014-2019 levels, or approximately 8.51x — broadly consistent with the actual figure of 8.9x.
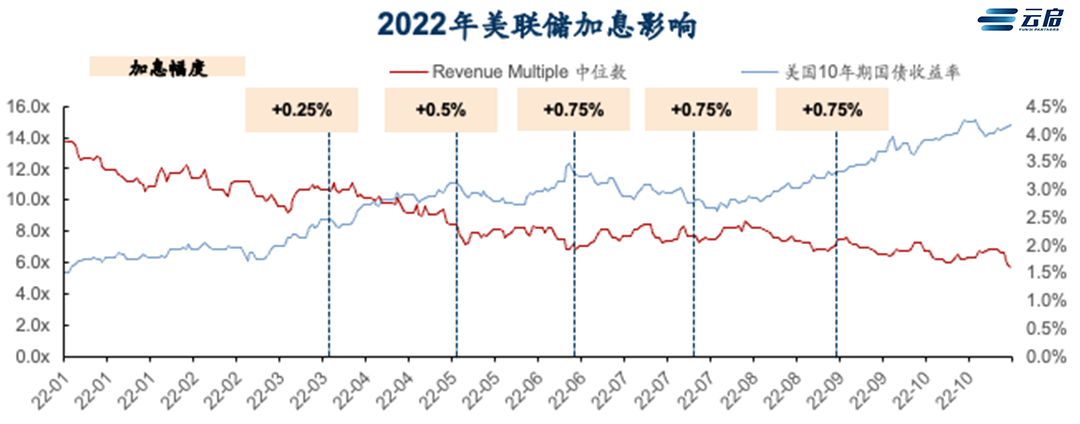
Fed rate hikes have had direct impact on equity markets. For example, on November 4, 2022, the 10-year Treasury yield reached 4.2%, up 1.89 percentage points from the 2014-2019 average of 2.31%. Based on regression calculations, the revenue multiple that day should have been 28.35% below 2014-2019 levels, or around 6.6x — broadly consistent with the actual figure of 6.1x.
For 2023-2025, we expect interest rates to transition from high to moderately high levels, while revenue growth transitions from low to stable. During this phase, revenue multiples are expected to resemble 2014-2019 levels (8-11x).
**➤ **Overview of A-Share Market Valuation
After understanding US markets, let's examine how A-shares value software.
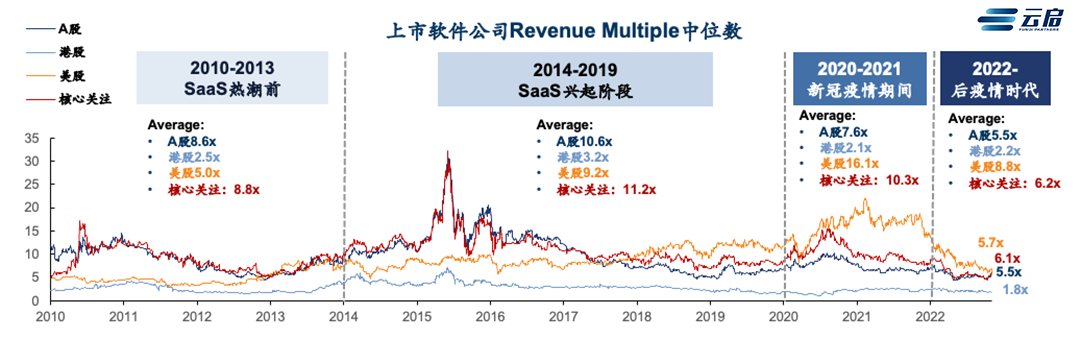
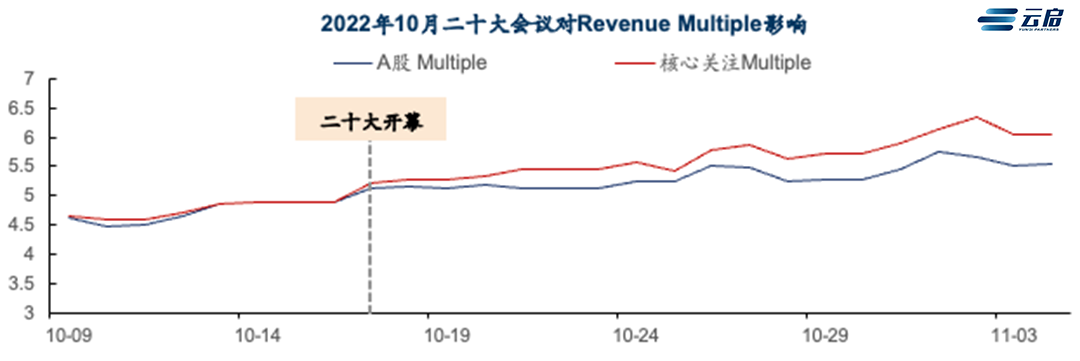
Overall, A-share software showed no significant valuation uplift during the pandemic, with less volatility than US software and stronger drawdown resilience. Following the 20th Party Congress, under the "information technology application innovation industry" (Xinchuang) concept, A-share software valuations rose markedly — up 20% overall in October, with core tracked companies up 30%.
We define core tracked companies as A-share and Hong Kong-listed companies with gross margin ≥40% (FY21), CAGR ≥10% (2019-2021), revenue growth ≥15% in their listing year, and backing from notable VC investors. Such companies drove valuation expansion during the software rise phase, tracking the overall A-share revenue multiple trend, outperforming the broader market during valuation corrections, and showing greater sensitivity to the Xinchuang concept. These companies also tend to command higher valuations.
Moreover, in recent periods, revenue multiples for A-share software core tracked companies have exceeded those of US counterparts.

Value and Pathways,
What Kind of Software Has Resilience?
Within a foreseeable horizon, overall economic downturn is an irreversible trend. Under this trajectory, how will enterprise software purchasing behavior change? Which types of software will enterprises favor?
Traditional software categorization has used frameworks like "horizontal vs. vertical," "SaaS vs. enterprise-grade," "tools vs. management," etc. However, analyzing performance across our sample, we found these conventional entry points yielded unsatisfying results.
We drew inspiration from customer feedback. Our entry point this time is "value proposition." On software review platforms like G2 and Product Hunt, we carefully read approximately 15-20 reviews for each software company's main product, then categorized sample companies based on "the value customers believe the software provides them." Based on value proposition, we developed the "AEPEC" five-dimensional model, classifying companies into five categories: Accuracy, Experience, Productivity, Efficiency, and Compliance.
In reading reviews, we found that a single product may deliver diverse value that's difficult to converge to a single dimension. Yet we also observed that over 90% of companies' value could converge to two dimensions, so we allow each company to belong to at most two value propositions.
- Accuracy: Enables companies to make more "precise" decisions, typified by BI analytics, etc.;
- Experience: Improves experience for a company's customers or users, typified by SCRM, CEM, etc.;
- Productivity: Enhances internal productivity, typified by project management and collaboration tools;
- Efficiency: Improves internal operational efficiency. Differs from Productivity in having stronger management attributes, typified by HCM, finance and tax software, etc.;
- Compliance: Ensures more compliant and secure operations, typified by anti-fraud, risk identification, and data security.
*Note: Due to limited available data and recurring-revenue company samples in the domestic market, we use US software as our primary data source (we consolidated companies commonly found in various software index funds, excluding atypical companies primarily focused on hardware/fintech, totaling 97 companies — 80 SaaS and 17 enterprise software).**
For observing corporate performance, we selected three key evaluation metrics: revenue growth, net new customer revenue growth, and sales efficiency (payback period), examining both absolute values and trend changes.
- Revenue Growth: Income growth rate, measuring industry development speed.
- Net New Revenue Growth: Revenue growth from new customers, measuring industry growth runway. Calculated as current quarter revenue minus prior quarter revenue, with year-over-year growth rate computed and median taken across category companies.
- Sales Efficiency (Payback Period): Cost incurred to acquire revenue, measuring customer acquisition difficulty. Since revenue growth and net new revenue growth can be artificially manipulated — for instance, through aggressive sales pushing that inflates revenue — sales efficiency measures how long prior quarter sales expenses take to recover. We believe this metric better reflects which products delivering which values make customers more willing to pay amid economic downturn. The calculation formula is as follows (similar to Jamin Ball's calculation for public companies, but we recommend a different algorithm for private companies, to be disclosed in a subsequent article):

➤ Revenue Growth
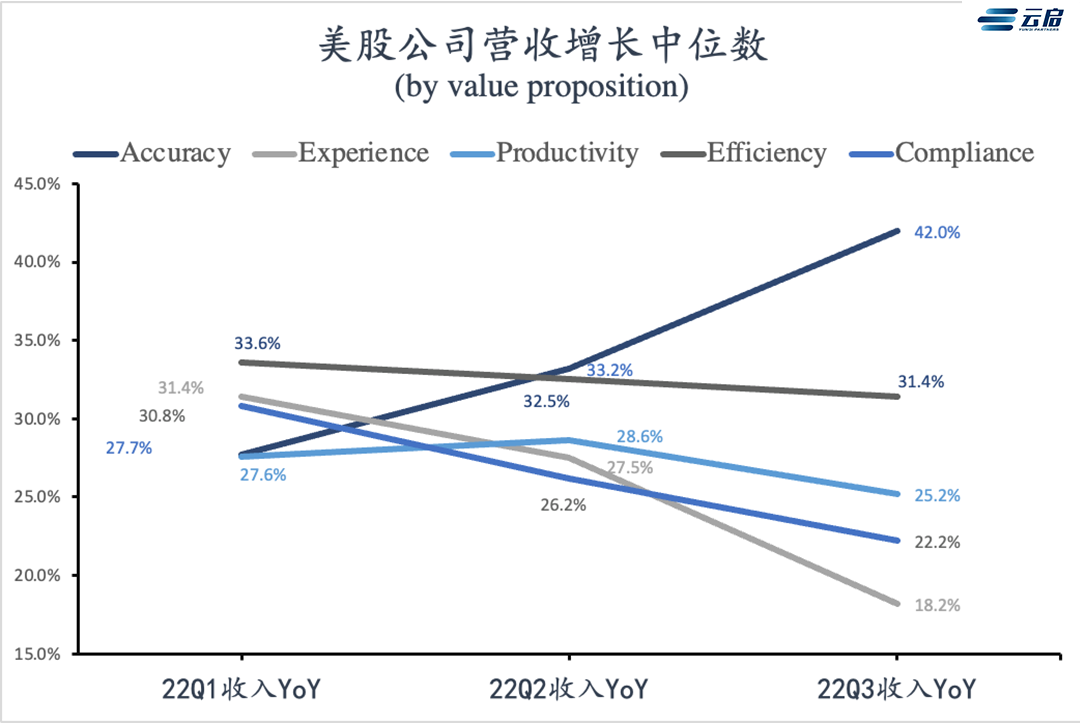
- From a revenue growth perspective, US software overall growth has slightly declined.
- From subsector trend perspectives, the Accuracy category shows fastest year-over-year revenue growth; Experience and Compliance categories have seen declining year-over-year revenue growth; Productivity & Efficiency revenue growth has remained roughly flat.
- From subsector absolute values, Accuracy and Efficiency categories showed faster growth in 22Q3.
➤ Net New Customer Revenue Growth (Net New ARR)
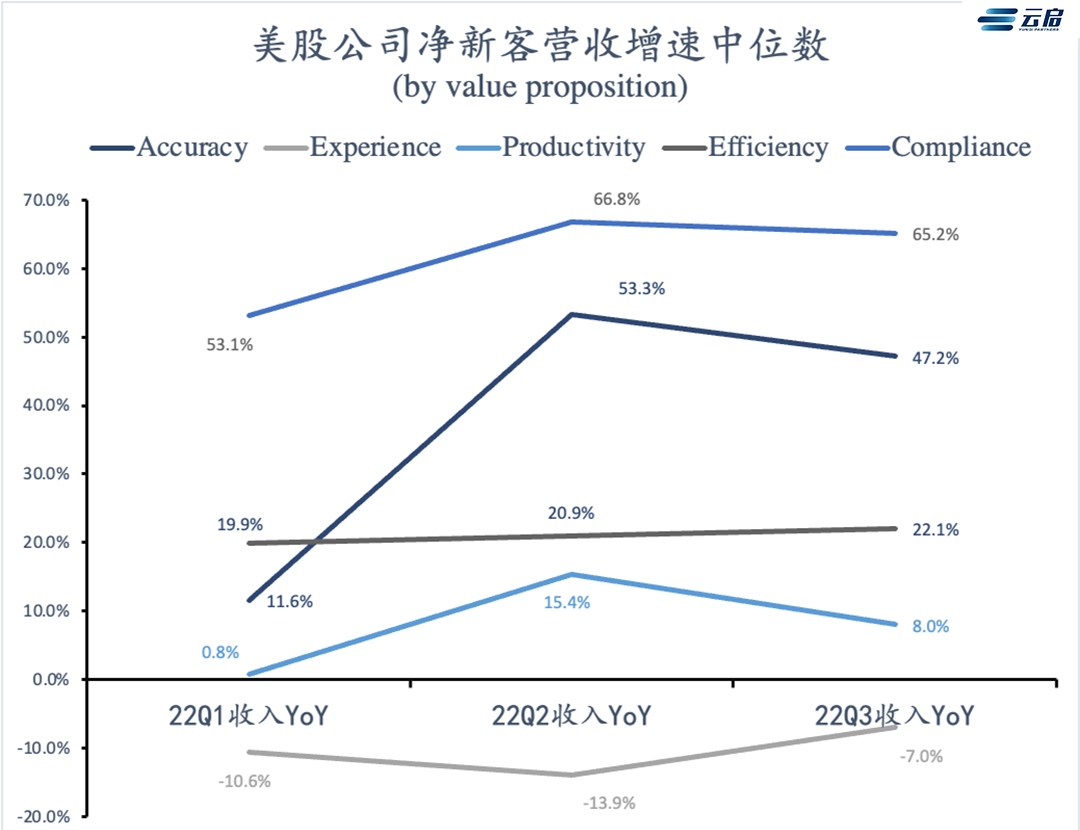
- From a net new customer revenue growth perspective, US software overall has seen marked growth deceleration.
- Unlike total revenue combining new and existing customers, net new customer revenue growth measures only income from new customers, reflecting new customer acquisition difficulty, industry penetration, and other factors.
- By subsector, Accuracy and Compliance categories show superior performance in net new customer revenue growth — both in trend changes and absolute growth rates. The Experience category has declined severely, while Efficiency and Productivity categories have been mediocre.
➤ Sales Efficiency
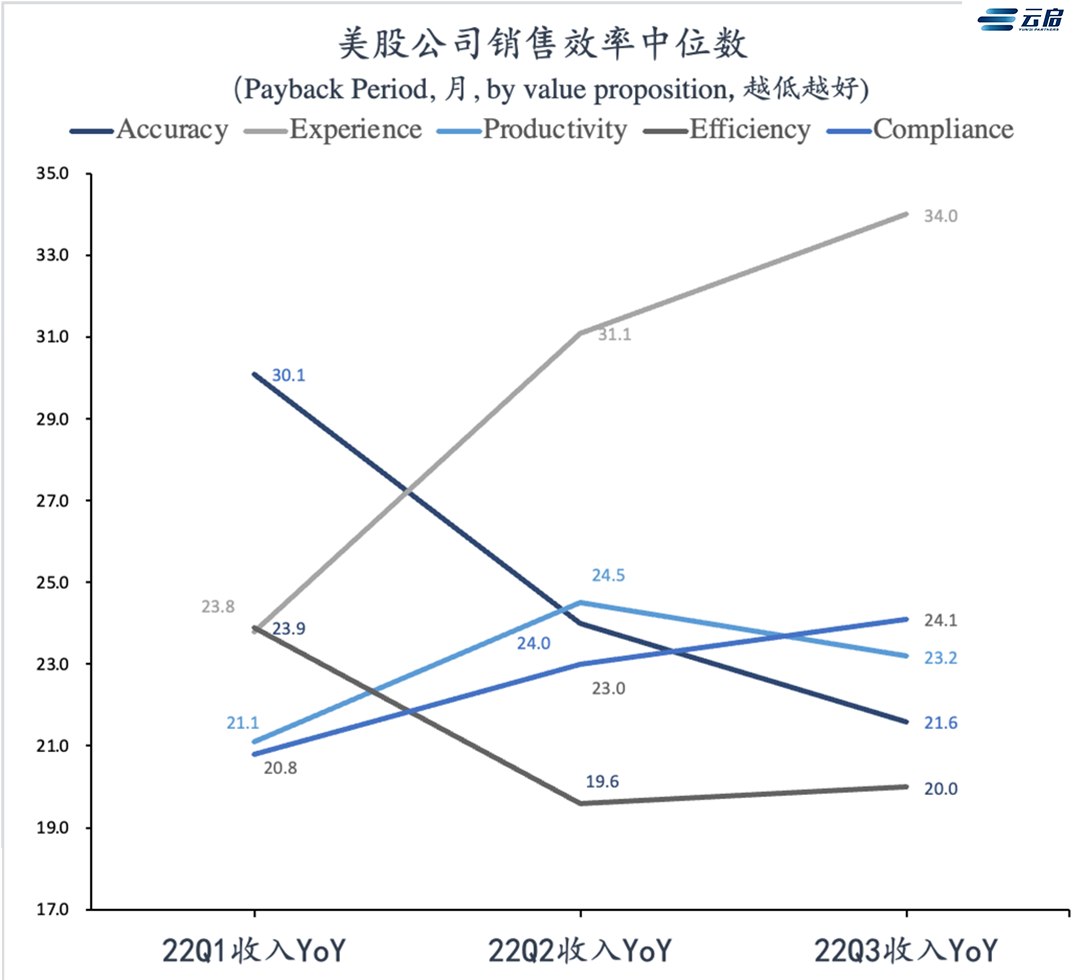
- Affected by rate hikes, sales efficiency overall declined in 22Q1, with longer payback periods.
- From subsector trend perspectives, Accuracy and Efficiency categories improved, while others declined.
- From absolute values, the Efficiency category shows highest sales efficiency; Accuracy, Productivity, and Compliance cluster in the same tier; the Experience category shows lowest sales efficiency.
Overall, from a performance perspective, the Accuracy category demonstrates the most favorable trends. We believe the primary reason is that while IT budgets have slowed they continue growing (Clouded Judgement 9.30.22, Jamin Ball). To meet performance growth and digital transformation requirements — especially constrained by economic downturn pressures — customers need to be more sensitive to ROI on their business decisions, requiring fuller data support to make more accurate decisions. In other words, we believe customers aren't out of money; they want to spend more "precisely."

The Listing Decision,
A-Shares or US Stocks?
Having covered entrepreneurial direction, let's discuss listing venues. We mapped basic profiles of A-share and US-listed software companies, identifying listing metrics and patterns. Through further Sino-US metric comparison, we found A-share and US-listed software profiles are distinctly different. Additionally, although the software industry has developed for years, digital transformation and cloud migration trends in both China and the US haven't slowed — they remain ongoing processes.
Due to space constraints, this article only roughly sketches contours of A-share software companies. We'll share more in-depth research on A-share software sub-listing boards (main board, STAR Market, ChiNext, Beijing Stock Exchange) in subsequent articles.
Listing Venue Selection and Business Model
➤ A-Share Software Company Screening and Classification
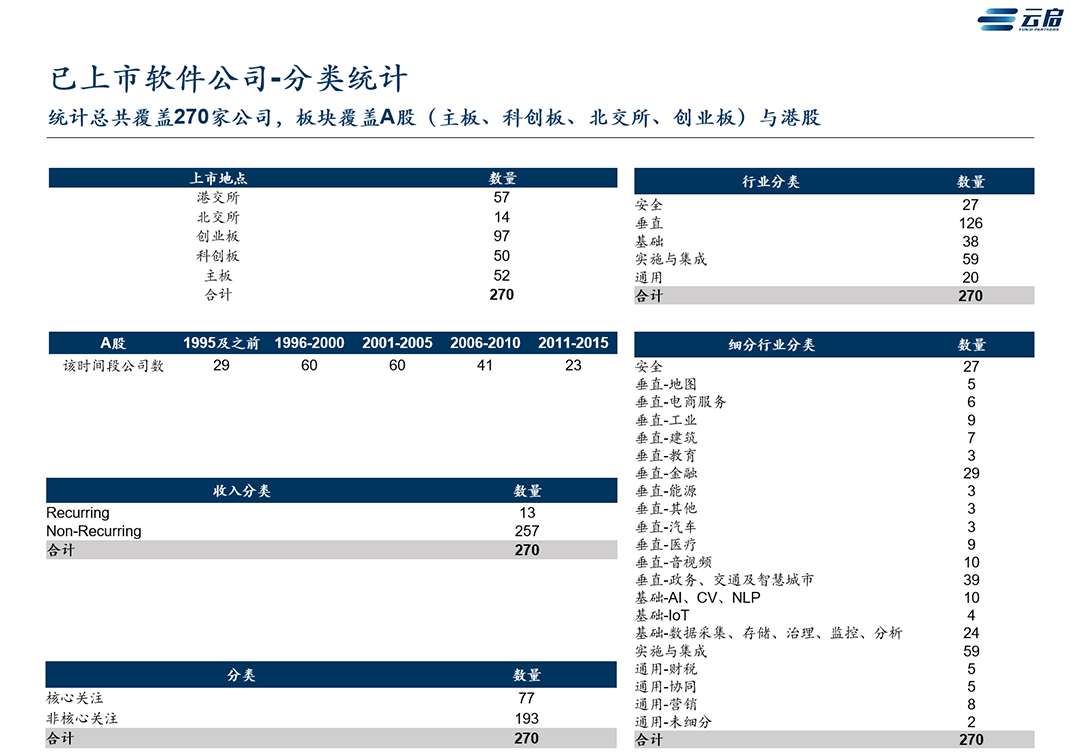
*Note: For mainland stocks, we selected 330 listed companies under Wind's Mainland Stocks - Software & Services category; for Hong Kong stocks, we selected 142 listed companies under the same Wind category. *We retained only: listed companies with FY21 gross margin no lower than 25%, excluding gaming companies, internet companies, hardware-focused companies, and financial companies primarily engaged in payment channel businesses.
We screened 270 software listed companies, broadly classifiable as follows:
- By industry: Security, Vertical, Infrastructure, Implementation & Integration, and General — five major categories.
- By revenue model: Recurring revenue and Non-Recurring revenue — two categories.
- By listing board: Hong Kong stocks and A-shares (Main Board, ChiNext, STAR Market, Beijing Stock Exchange).
- By founding year: 1995 and earlier, 1996-2000, 2001-2005, 2006-2010, 2011-2015.
On this basis, we define core tracked companies as A-share and Hong Kong-listed companies with gross margin ≥40% (FY21), CAGR ≥10% (2019-2021), revenue growth ≥15% in listing year, and backing from notable VC investors.
➤ US and A-Share Software Companies Show Significant Differences in Financial Profiles at IPO
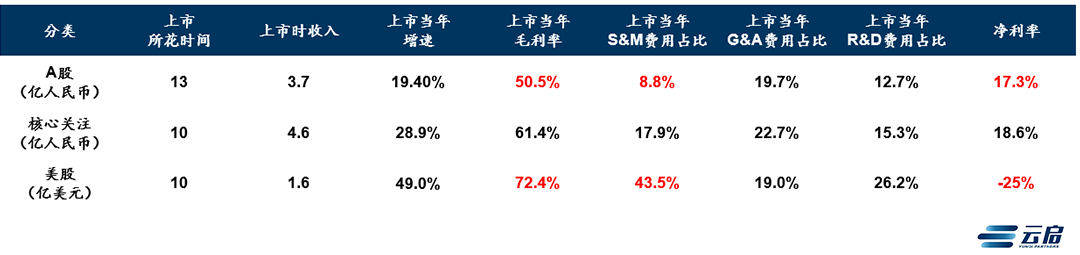
- A-share and US software differ significantly in gross margin, sales expense ratio, net margin, and other metrics. US markets weight revenue growth and revenue quality (gross margin) more heavily, while A-shares overall prioritize net margin.
- The basic profile of A-share software companies at IPO: approximately RMB 300 million revenue, ~20% growth, ~50% gross margin, 10% sales expenses, 20% administrative expenses, 10-15% R&D expenses, 15-20% net margin.
- From time to listing, A-shares take longest at 13 years, possibly due to more traditional software companies raising the average. Core tracked companies take 10 years to list, same as US companies.
Overall, A-share software companies present a distinctly different profile from US counterparts. A-share business models fall into three main types: pure product companies, solution providers with products, and pure implementation/integration vendors; US markets are dominated by pure product companies. We advise companies to consider listing venue selection early, as different venues require substantially different metric profiles — which determines how companies trade off between revenue scale, growth, quality, sales efficiency, and three-expense ratios, further determining business model, which in turn affects product design, sales approaches, and team building decisions.
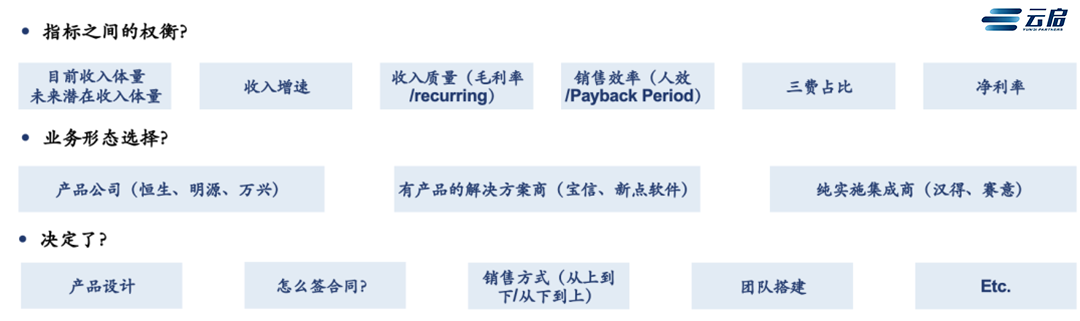
Although A-share software currently has numerous implementation/integration vendors, examining CSRC-approved companies in recent months (e.g., Zhongchuang, Hechuang, Dameng, Suochen) and companies in the listing pipeline reveals an unmistakable trend: A-share listed software companies are becoming increasingly higher quality, with stronger product attributes.
The Digital Transformation Wave Hasn't Stopped; Software's Future Remains Promising
➤ The Digital Transformation Wave Hasn't Stopped
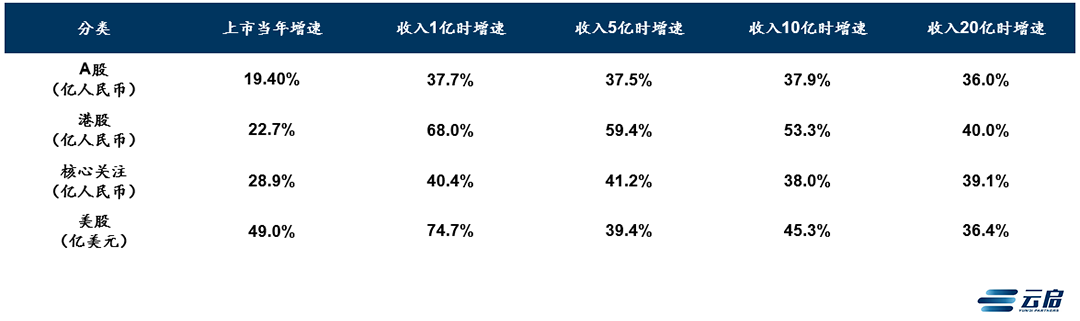
From a ceiling perspective, A-share, Hong Kong, and US software companies show no obvious growth deceleration at revenue milestones of RMB 100 million, 500 million, 1 billion, and 2 billion — indirectly validating that overall digital transformation and cloud migration trends remain ongoing processes.
➤ China's Software Development Future Remains Promising
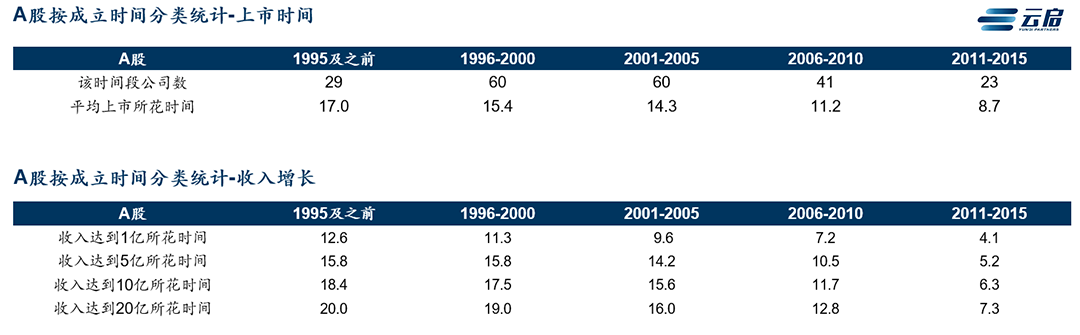
- Although overall listing cycles remain somewhat long, examining by founding period reveals that newer companies' listing cycles are progressively shortening — from 17 years average for companies founded in 1995 or earlier, to just 8.7 years for companies founded between 2011-2015.
- From time required to achieve certain revenue growth milestones, newer companies are also reaching specific revenue scales faster. Companies founded between 2011-2015 needed only 4.1 years to reach RMB 100 million revenue, versus 9.6 years for companies founded between 2001-2005.
The later a software company was founded, the shorter its time to listing and the faster its revenue growth. This indirectly demonstrates that China's overall software ecosystem is steadily improving. Product-focused software companies have a promising future.

Summary: After the Harsh Winter, Spring Returns
- From a valuation perspective, after US stocks experienced rapid valuation ascent in 2021 and correction in 2022, we believe US software company valuations will gradually normalize to 8-11x revenue multiple levels in 2023-2025.
- From a performance perspective, although overall software growth is decelerating, software companies delivering "Accuracy" and "Compliance" value show standout metrics across indicators.
- From a Sino-US comparison perspective, Chinese and US listed software companies have completely different metric profiles, leading to divergent choices in business model, sales strategy, and other dimensions — which entrepreneurs should systematically consider.
After the harsh winter, spring returns. For Yunqi Capital, while we track software companies with global potential, we equally maintain confidence in Chinese software companies aligned with demand and market dynamics. With persistent aspiration to discover future pioneers, continuously supporting entrepreneurs and the enterprise software sector, Yunqi Capital remains committed to being a long-term companion for tech-to-B.
Recently, OpenAI and Microsoft have taken turns in the spotlight — GPT-4 the day before yesterday, Copilot yesterday. The tech world seems to have welcomed an epoch-making gala. The entire industry anticipates a new technological revolution, and enterprise software is no exception — its form and business models will inevitably transform. How the future scroll of enterprise software will be written, let us wait and see!
The précis of our report concludes here, but Yunqi Capital's support continues. We aspire to explore flashes of enterprise software innovation alongside entrepreneurs. Going forward, Yunqi will extend key insights from this report into a series of sharing events, discussing critical questions in enterprise software with entrepreneurs and industry experts — such as how to define a good business, how to select suitable customers, and more. Stay tuned.