AI Development Through the Lens of U.S. Software Company Statistics | 5Y View

The teams that can rise to today's challenges will have the chance to become tomorrow's iconic companies.

Recommender

Kai Liu, Partner at 5Y Capital
Translated from Emergence's Beyond Benchmarks
Emergence Capital is a well-known American SaaS venture capital fund. Their latest Beyond Benchmarks report, published in April 2024, collected data from over 600 B2B SaaS companies, making its findings on the current state of AI development in U.S. software companies a meaningful reference point.
Here are the three core takeaways from this report:
ARR growth rates dropped significantly in 2023, with growth-stage companies hit hardest. As customers became more cautious about software purchases, many software companies failed to hit new booking targets and faced high churn and downgrade rates. Consequently, many companies cut staff to reduce expenses and extend runway.
Compared to previous years, fundraising has become markedly more difficult. Both the number and size of VC deals have declined. GenAI companies are the exception, with valuations and round sizes 50–100% higher than other software companies.
In 2023, 60% of companies launched products using GenAI technology. We are currently in the early stages of the GenAI transformation, with startups actively experimenting. The most pressing challenges are how to achieve GenAI profitability as quickly as possible, drive changes in user behavior, and ensure the protection of proprietary data and intellectual property.
Despite headwinds from growth resistance and the funding environment, we believe now is the best time to build era-defining companies. We have witnessed paradigm shifts in business cycles before, and only teams that can navigate today's challenges will have the opportunity to become iconic enterprises of the future.
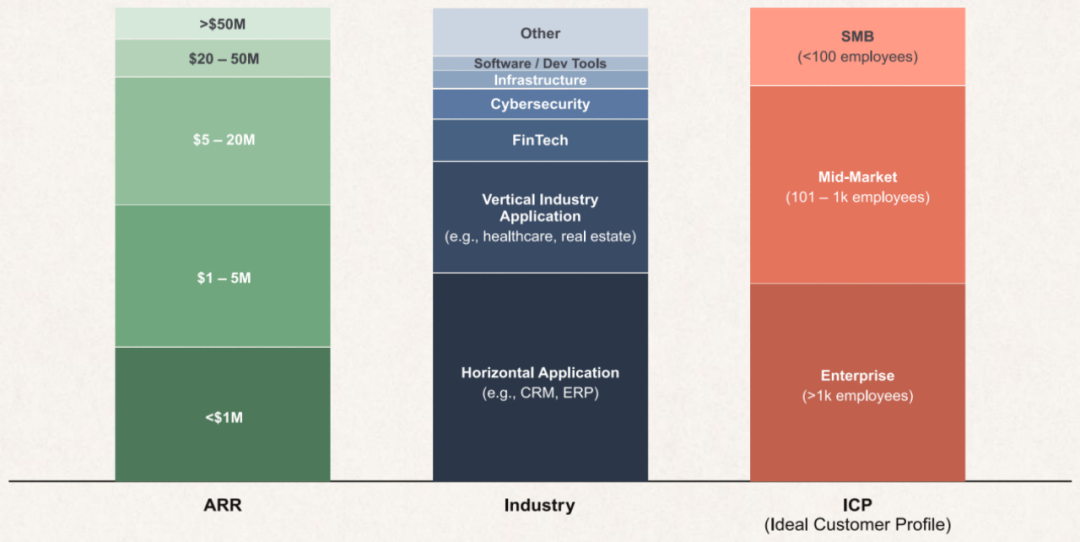
Benchmark Sample Size (664)
PART 01
GenAI Trends
60% of Companies Have Adopted GenAI in Their Products
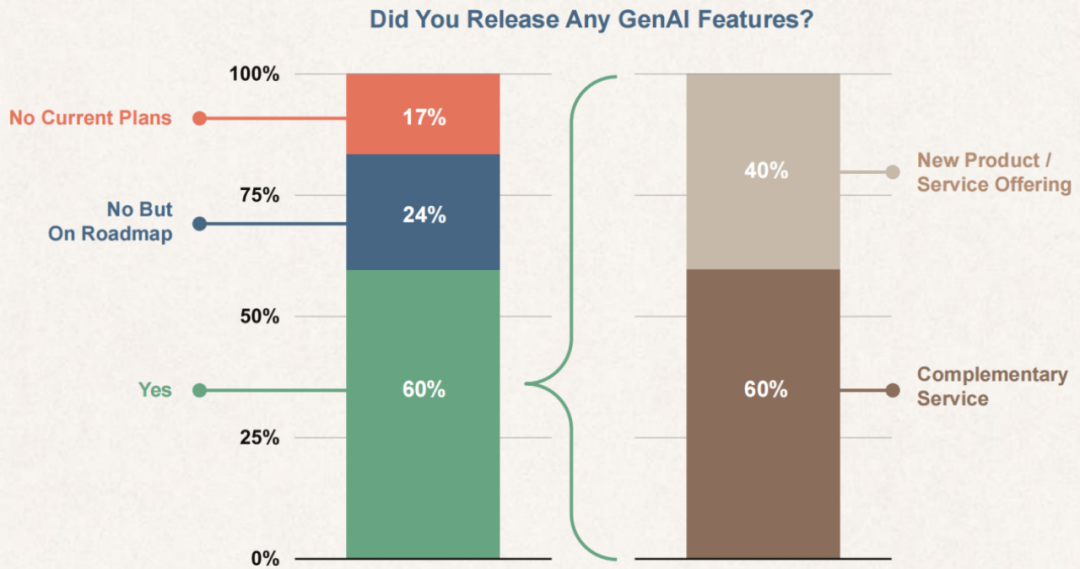
Most companies have already launched GenAI products or features, while those that haven't mostly plan to do so within this year. As a founder, if you haven't yet considered how to use GenAI to enhance product capabilities and drive business growth, you risk being overtaken by competitors.
Among companies that have added GenAI features to their products, most treat it as a feature or add-on to existing products; only 40% have launched entirely new products or SKUs.
Companies Are Experimenting with Different Pricing Models
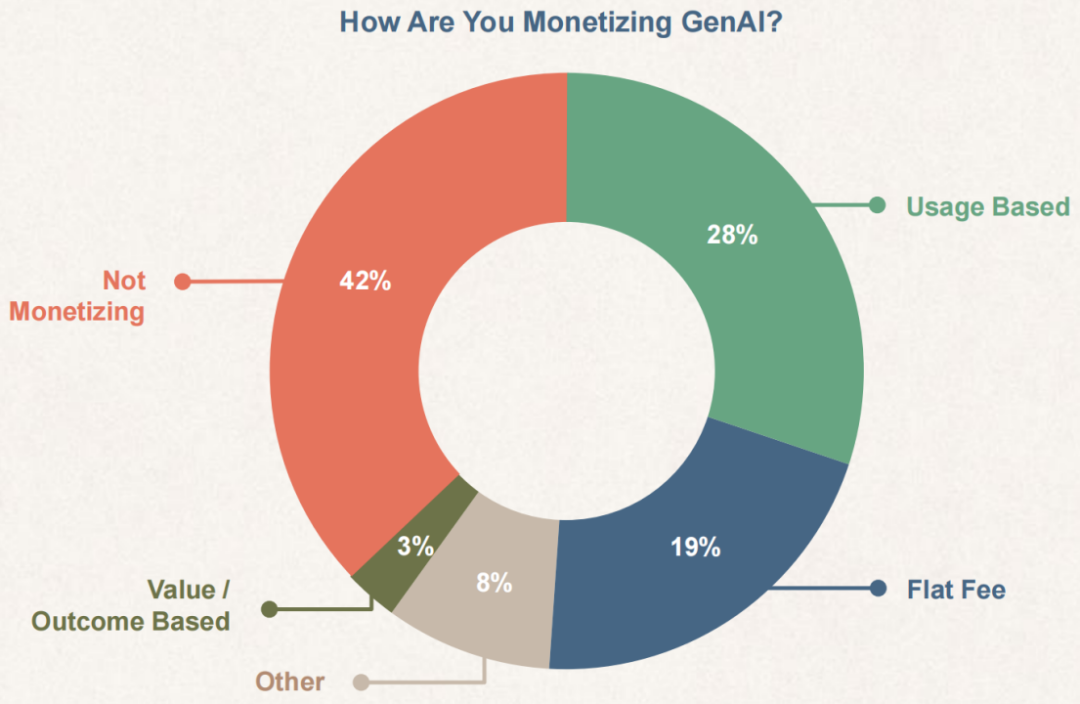
Only 58% of companies' GenAI products are near profitability. This is a potential challenge because GenAI inference costs are significantly higher than traditional software.
Nearly half of profitable companies use usage-based pricing, which helps ensure balance between revenue and costs, enabling predictable returns.
One-third of companies choose flat-fee pricing. While this model helps accelerate customer adoption, it also makes cost forecasting more difficult. Nevertheless, our research shows that, on average, companies using flat-fee pricing have higher gross margins than those using usage-based pricing.
OpenAI Is the Most Widely Used LLM
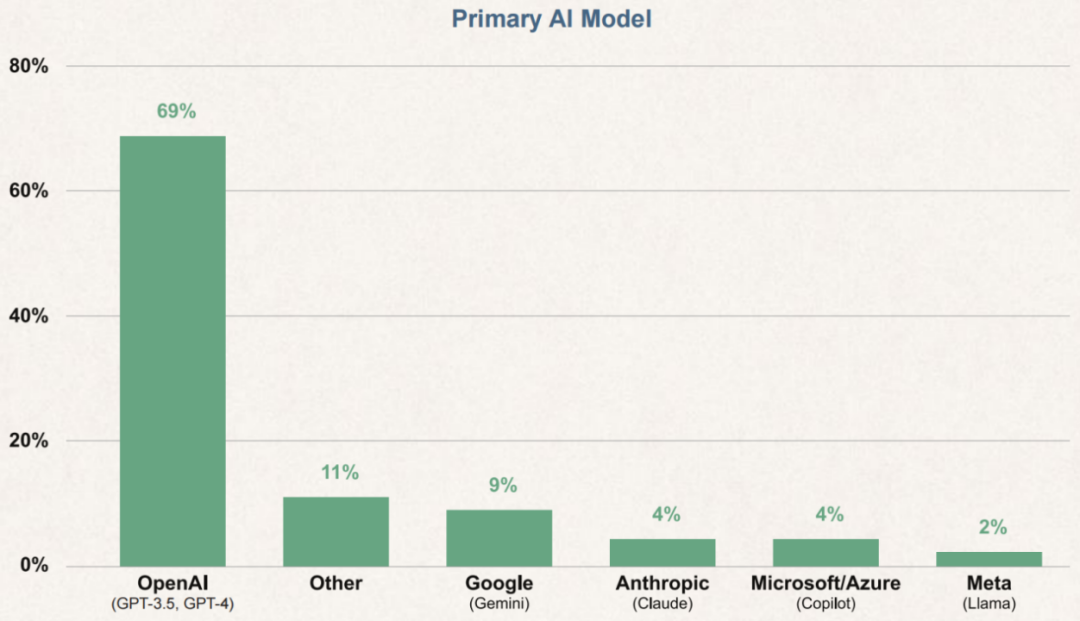
69% of companies report that OpenAI's GPT-3.5 or GPT-4 is their preferred LLM. Given the current early adoption stage, it makes sense for companies to trial OpenAI and other closed models, as upfront investment costs are low and API access is highly convenient.
However, we note that companies are experimenting with multiple models, and an early trend is slowly emerging: intelligently routing GenAI inference requests to different models based on cost, performance, and security needs.
Companies Building GenAI Features Have Increased R&D Investment by an Average of $2 Million
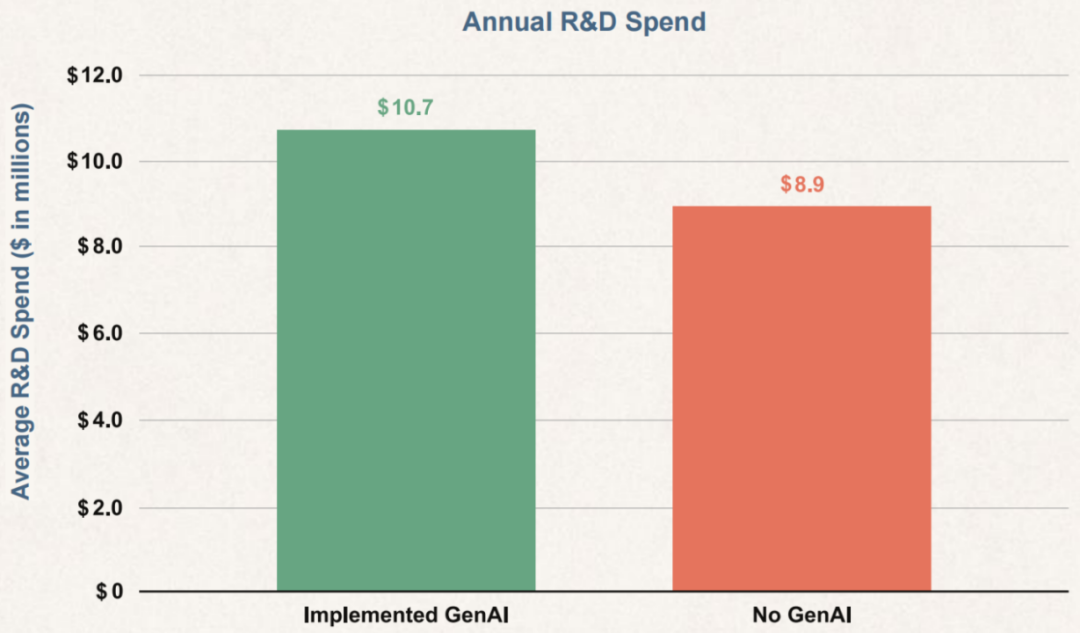
Companies investing in GenAI product features have seen their annual R&D expenses increase by approximately 20% on average. Startups with AI research teams have even higher R&D expenses, as building proprietary foundation models is central to their intellectual property. Some companies are reportedly fine-tuning open-source models, though this requires greater R&D investment.
Companies Developing GenAI Features Have Seen Net Dollar Retention Improve by 7%
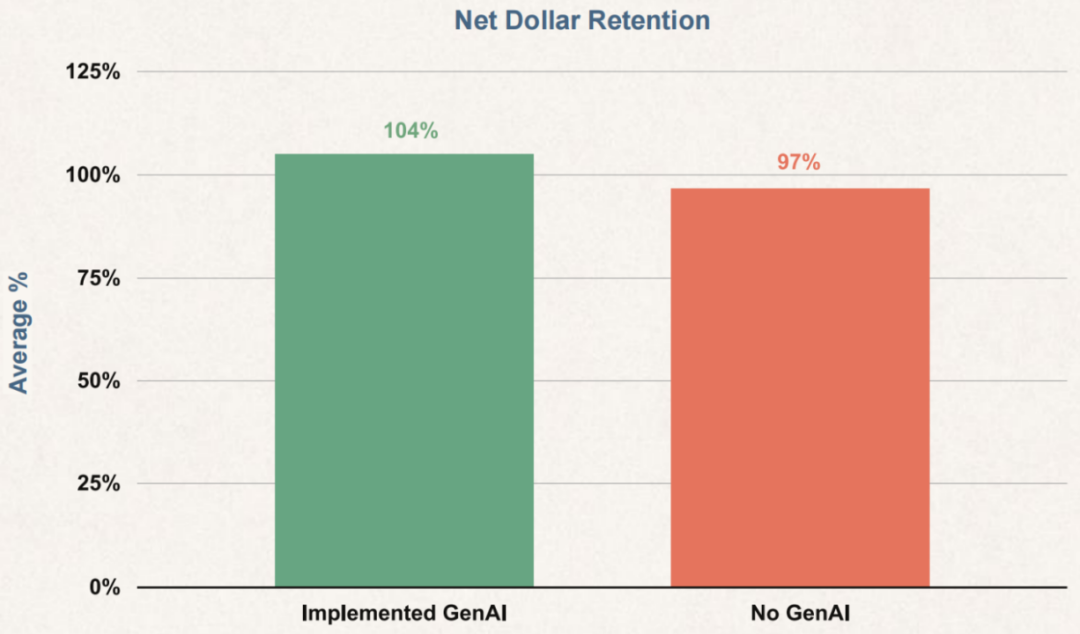
Companies implementing GenAI have net dollar retention (NDR) 7% higher than those that haven't. This is likely due to price increases for GenAI features or new product launches driving sales. This is significant because NDR is the primary driver of revenue growth as companies scale, and negative churn has a compounding effect.
GenAI-Native Companies Have Received the Most Investment
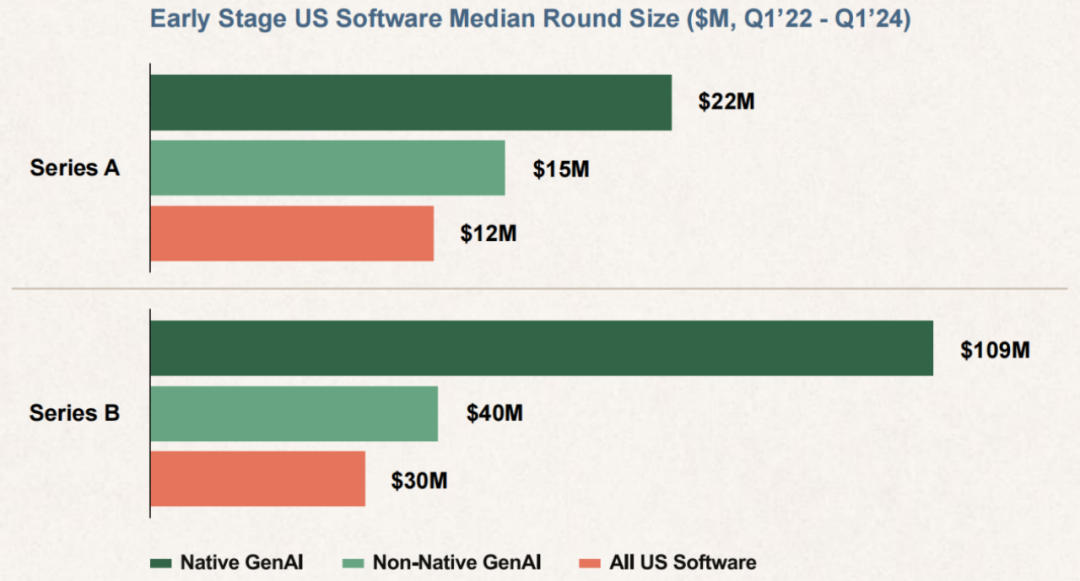
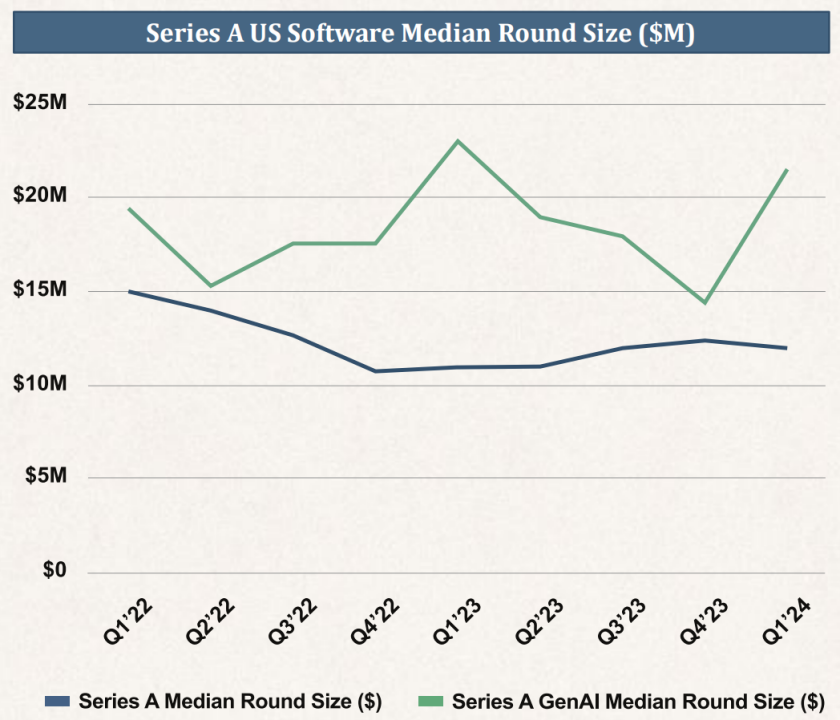
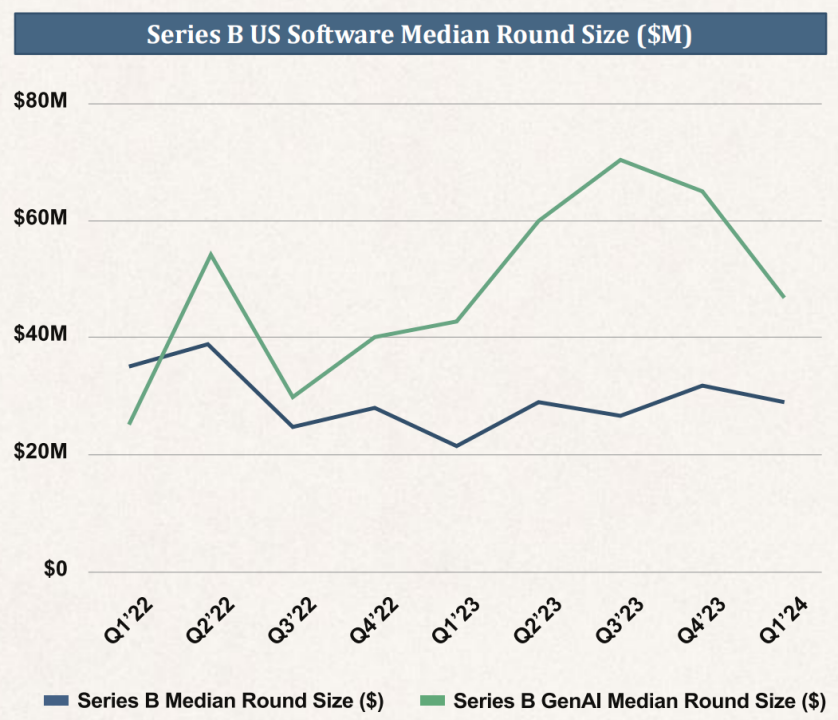
GenAI-native companies are built on GenAI technology from inception. Due to strong market demand, high GenAI talent costs, and expensive GPU equipment, these startups' Series A round sizes have grown by an average of 80%, while Series B rounds have surged by 260%.
Approximately two-thirds of early-stage GenAI investment has gone to companies transitioning to GenAI. These "non-GenAI-native" companies can command significant premiums. These non-GenAI-native startups typically pivot from fields related to MLOps or data infrastructure.
PART 02
Fundraising
The Primary Market No Longer Worships Growth Alone
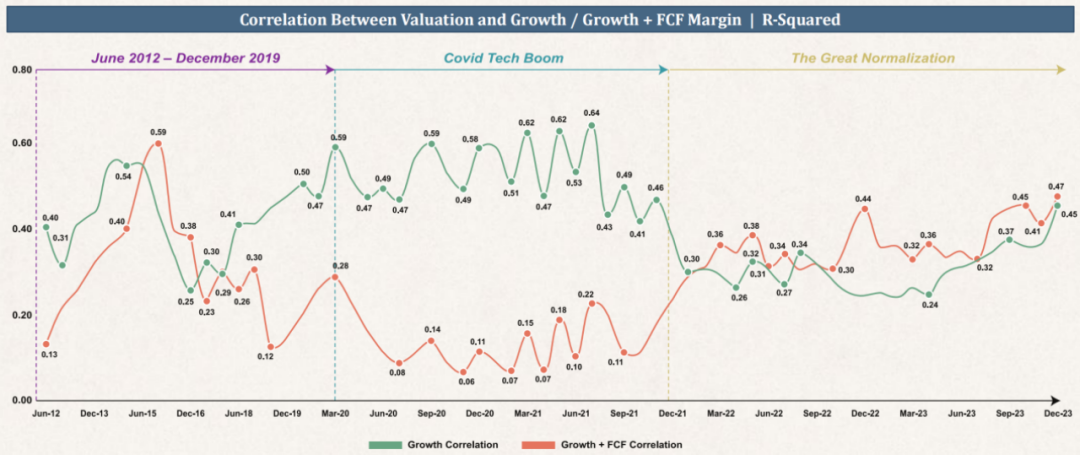
The Primary Market's Valuation Premium for Growth Remains 2–3x That of Profitability
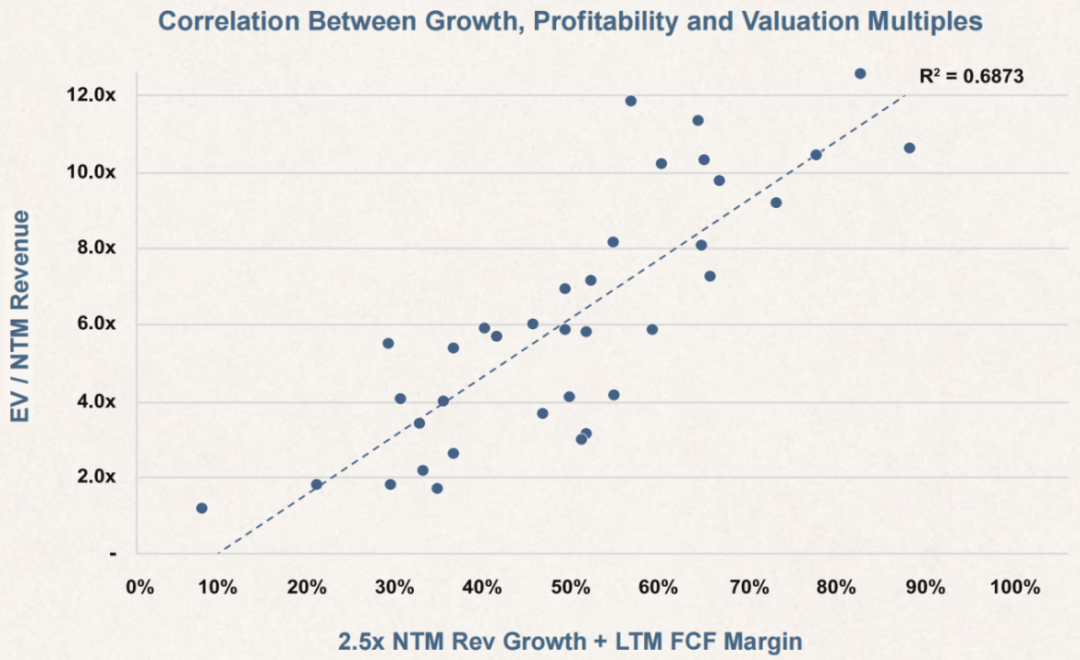
During the high-multiple period of 2020–2021, the validity of the "Rule of 40" (growth + profitability) was challenged, but as growth slowed, investors began refocusing on profitability. Through multiple regression analysis of NTM data from 40 SaaS companies, we found that the valuation premium coefficient for growth is 2–3x that of profitability, and both variables are statistically significant. In summary, public market investors value growth at a 2–3x premium to profitability, and this standard influences the private market as well.
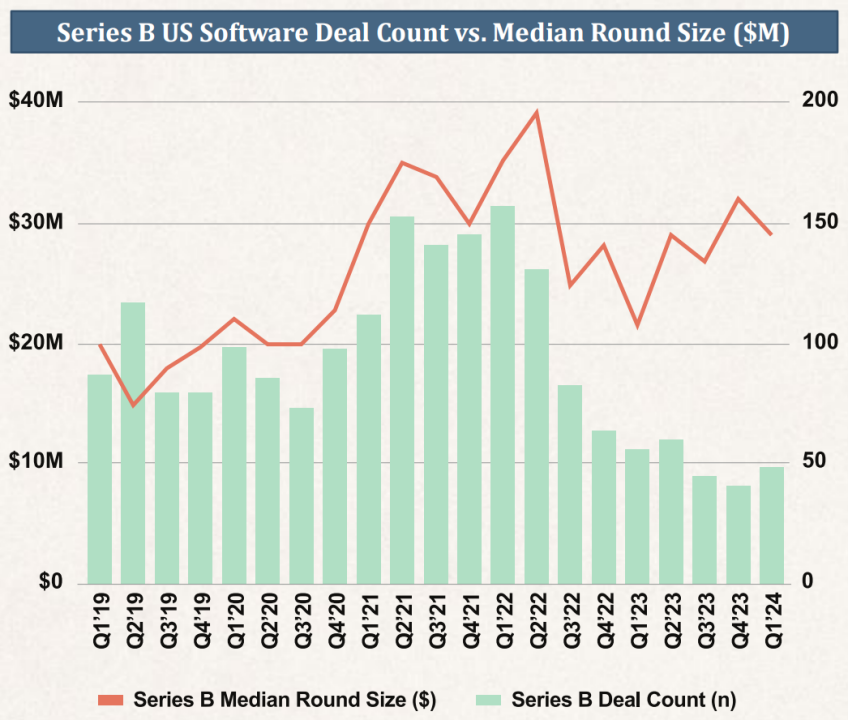
U.S. Software VC Activity Has Declined Since Peaking in 2021
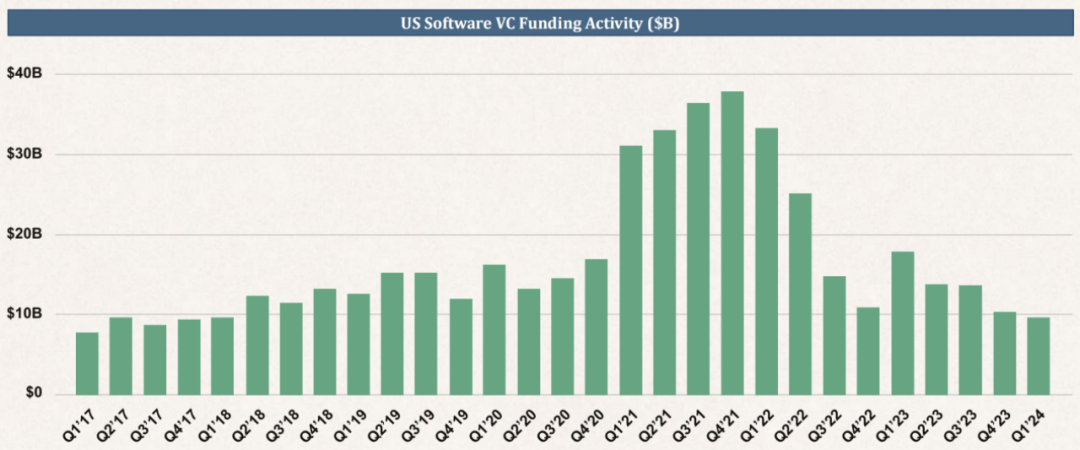
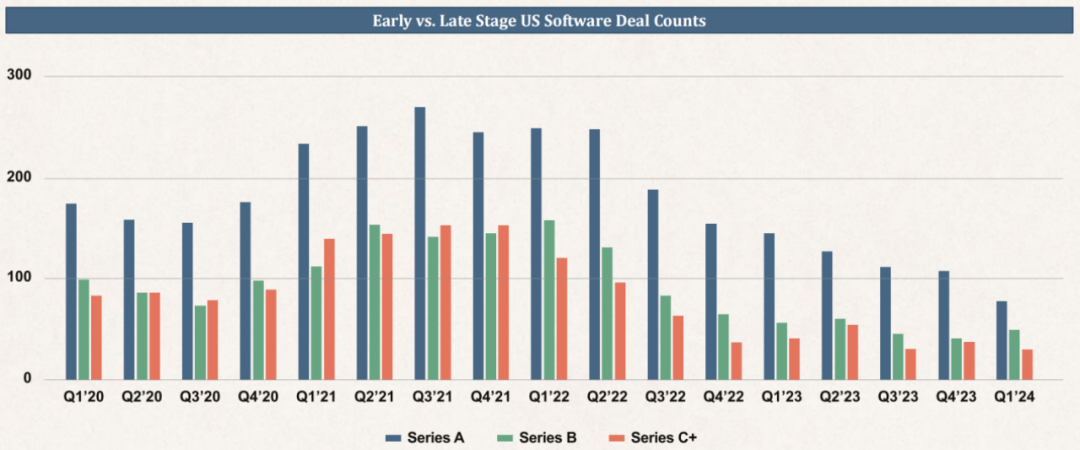
VC Deal Volume Has Dropped Sharply Across All Stages
Early-Stage Round Sizes Fell from Peaks but Have Recently Rebounded
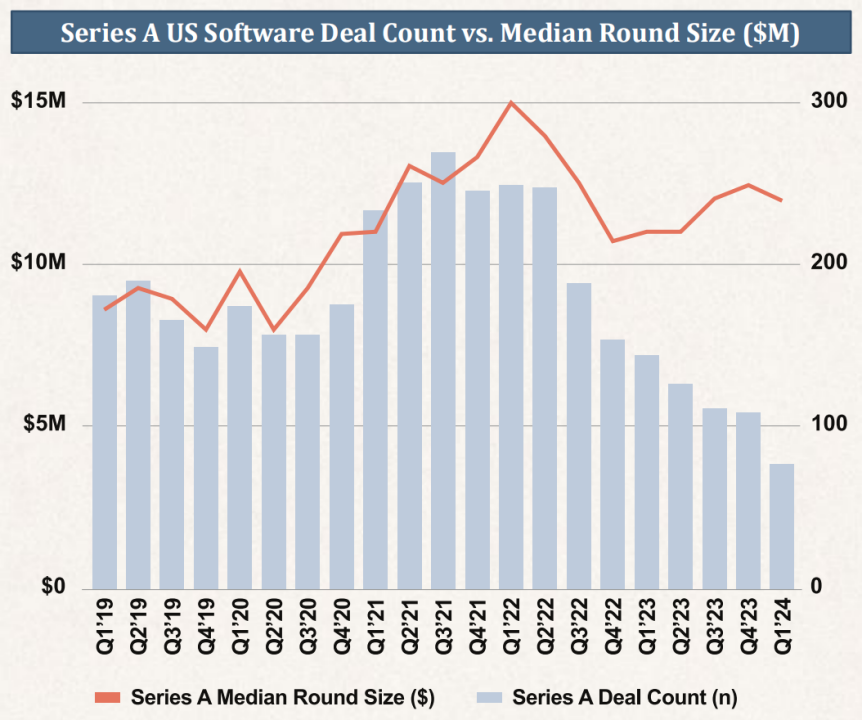
GenAI Investment Has Driven Growth in Round Sizes
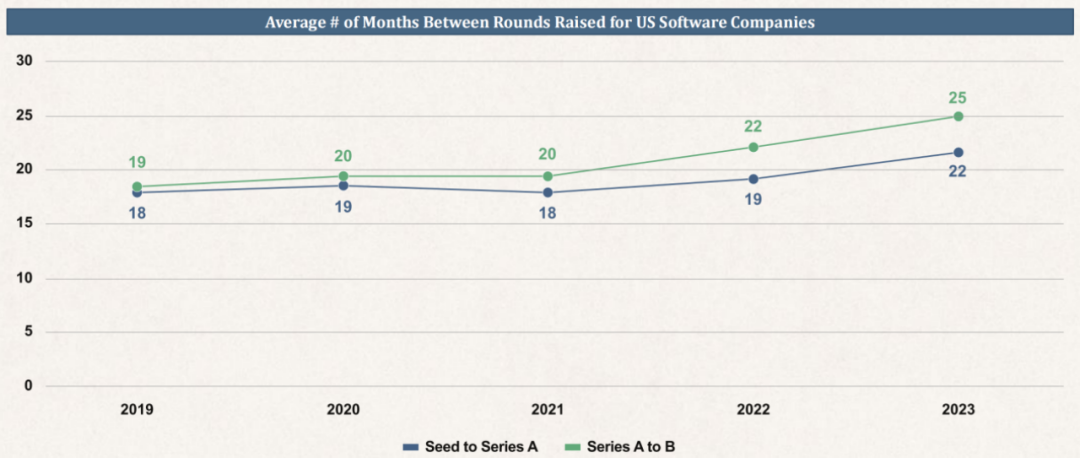
Time Between Rounds Is Increasing for Early-Stage Companies
Facing a Harsh Capital Environment, Companies Have Delayed Fundraising Plans
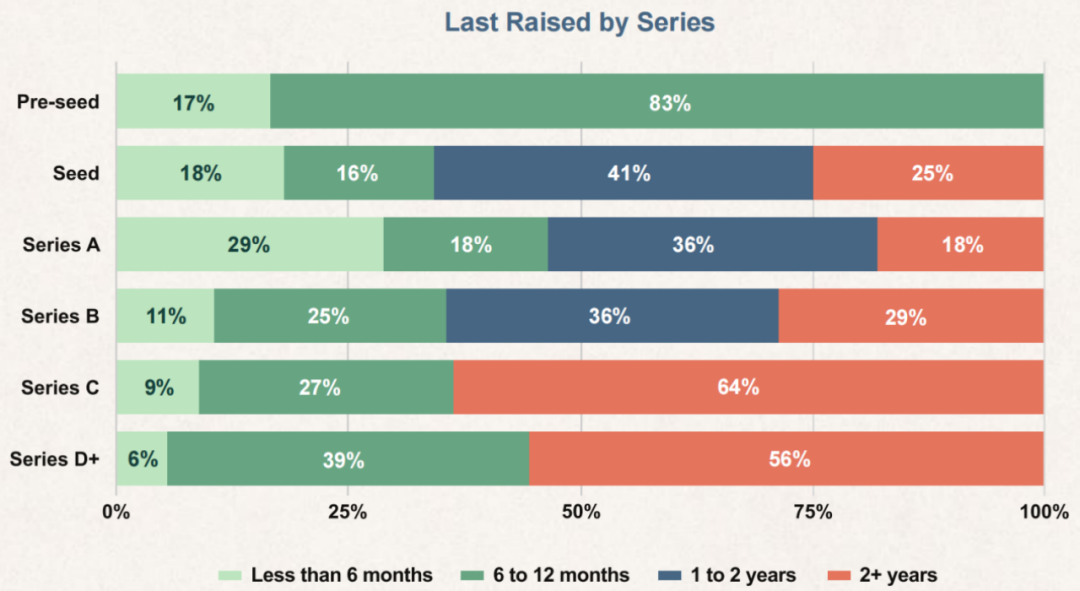
As the funding environment has grown increasingly severe, companies have cut costs to extend runway and delay new rounds. This affects companies across all development stages, with growth-stage companies hit hardest — approximately 60% of Series C and later companies last raised two years ago.
We are witnessing a "financing crisis." Many companies that reduced costs aren't growing fast enough to raise new capital, while reaccelerating growth requires significant capital investment, which in turn substantially increases costs. This dilemma is repeating throughout the system.
PART 03
Company Performance Metrics
The Emerging Four Core Metrics
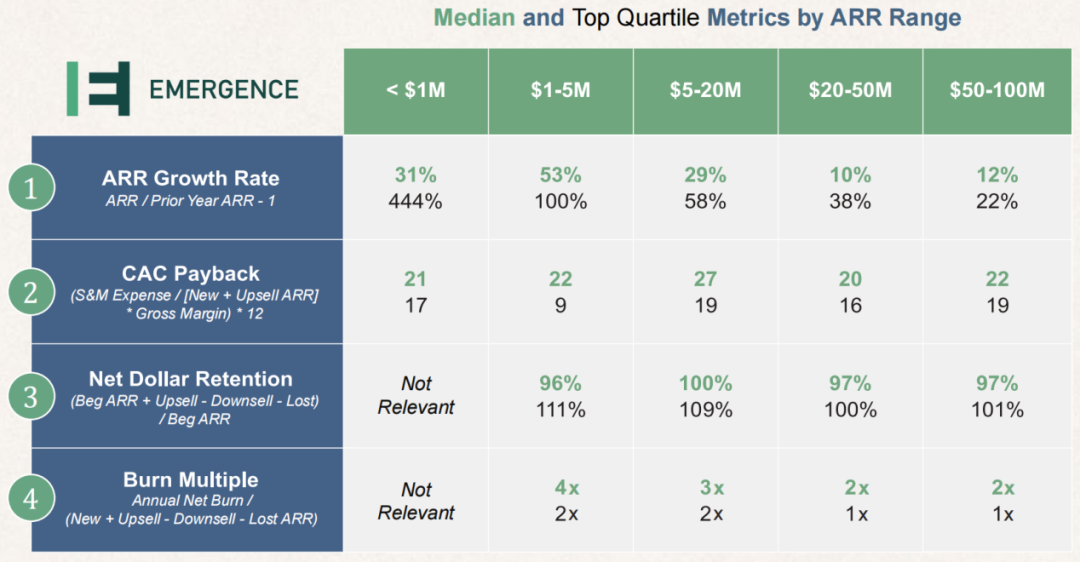
ARR growth rate reflects a company's growth velocity and is one of the most valuation-relevant metrics.
CAC payback period measures the time required to recover customer acquisition costs through customer revenue, and is one of the key indicators of new sales efficiency.
Net dollar retention (NDR) measures a company's ability to retain and expand existing customers, and is one of the most critical indicators of customer health and product-market fit.
Burn multiple is a comprehensive measure of capital efficiency, providing a broad perspective on the business and a useful snapshot of overall business health.
Top-Quartile Software Startups Grow ARR at Roughly 2x the Median Rate
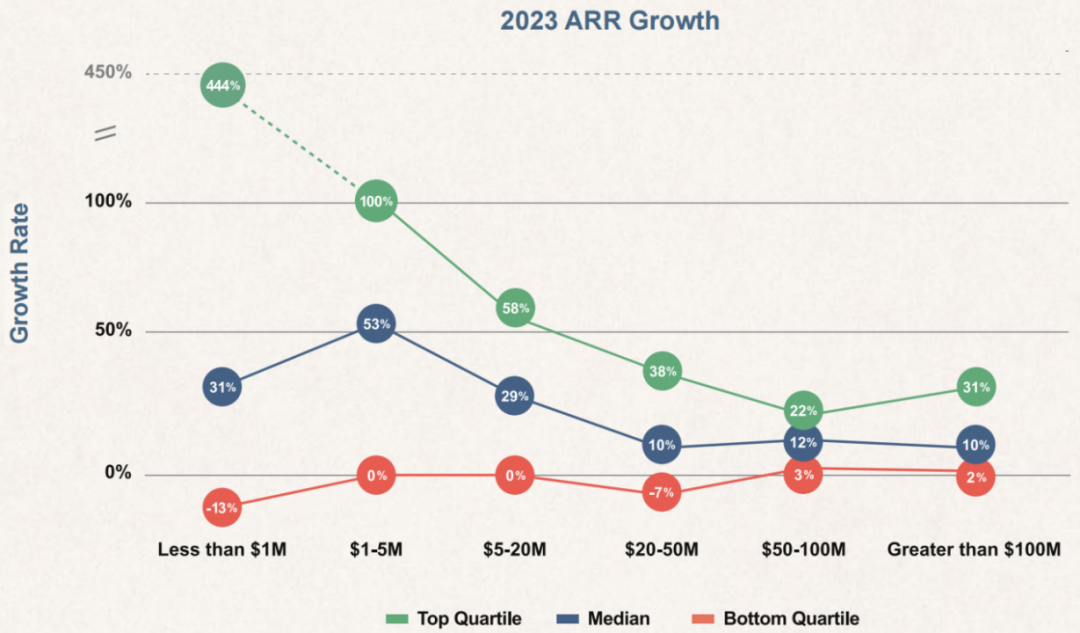
Despite challenging macro conditions in 2023, top-quartile companies continued to perform well.
For growth-stage companies with ARR between $20 million and $50 million, growth rates varied dramatically. This may be due to churn having a significant impact on companies at this stage.
Bottom-quartile startups showed declining trends across all stages.
We noted that companies targeting mid-market customers declined most sharply, while those targeting SMBs actually saw increases. In contrast, companies targeting large enterprises remained essentially flat.
Average ARR Growth Rates Declined in 2023
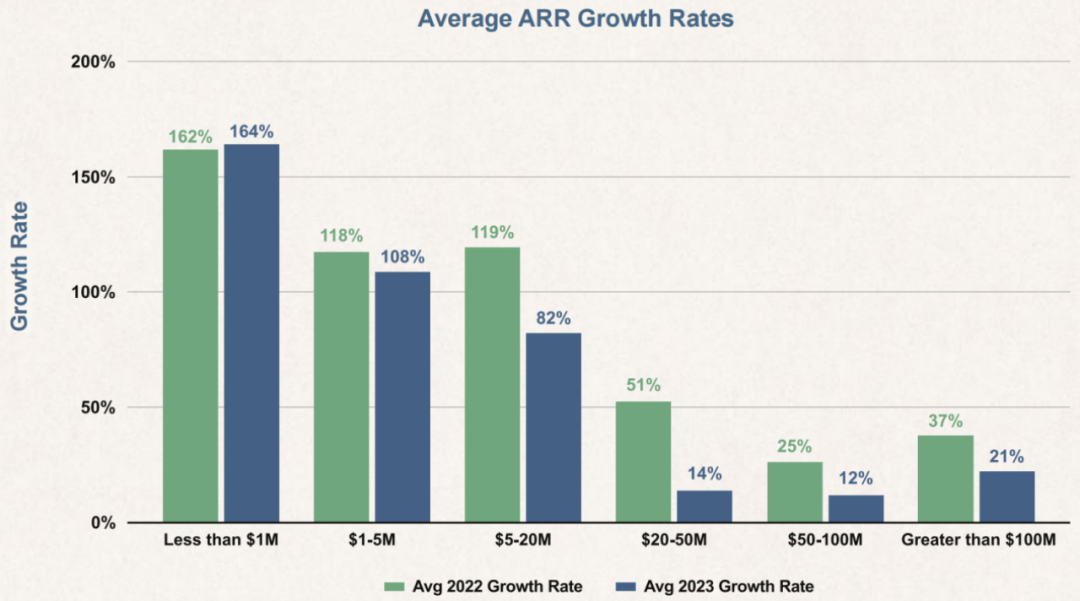
Growth-stage startups experienced the largest decline in average ARR growth, driven by two main factors:
Customers reassessed software procurement, and new booking targets were not achieved; customers cut costs directly (canceling software) or indirectly (reducing seats through layoffs), increasing churn and downgrade rates across the customer base.
Early-stage companies faced similar challenges but were relatively less impacted due to smaller booking targets and existing customer bases.
Both GDR and NDR Declined in 2023
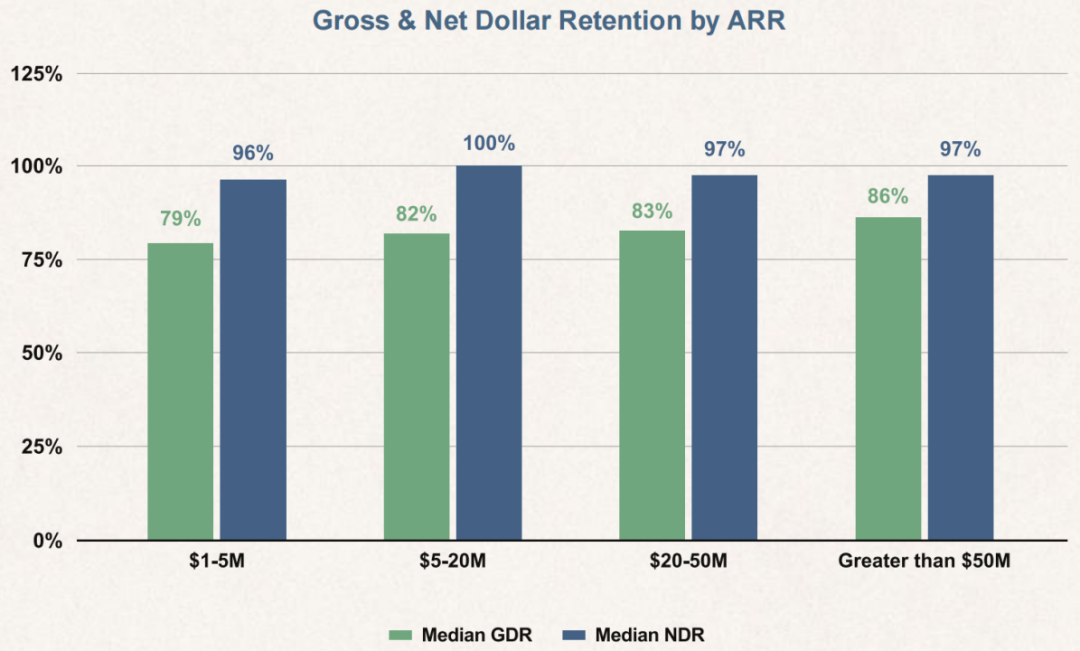
GDR reflects a company's ability to retain existing customer ARR. The difference between GDR and NDR reflects a company's ability to upsell and expand. We noted that GDR was 10 percentage points lower than in previous years, and NDR was 15 percentage points lower.
Top-Quartile Companies Retain Approximately 90% of ARR
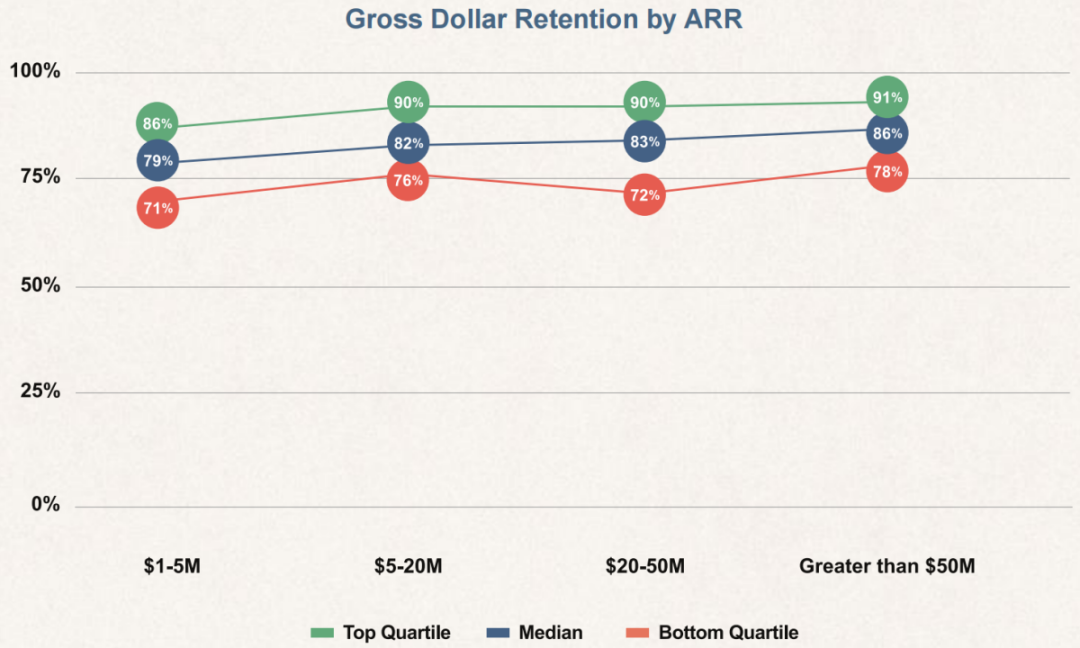
As companies solidify product-market fit and customer success (CS) teams provide better onboarding and support, GDR typically improves.
As companies scrutinize software spending more carefully, we found significant differences in GDR based on business model: subscription models averaged 85% GDR, while usage-based models averaged 43% GDR.
Top-Quartile Companies Outperform on Upsell Relative to Churn Across All Stages
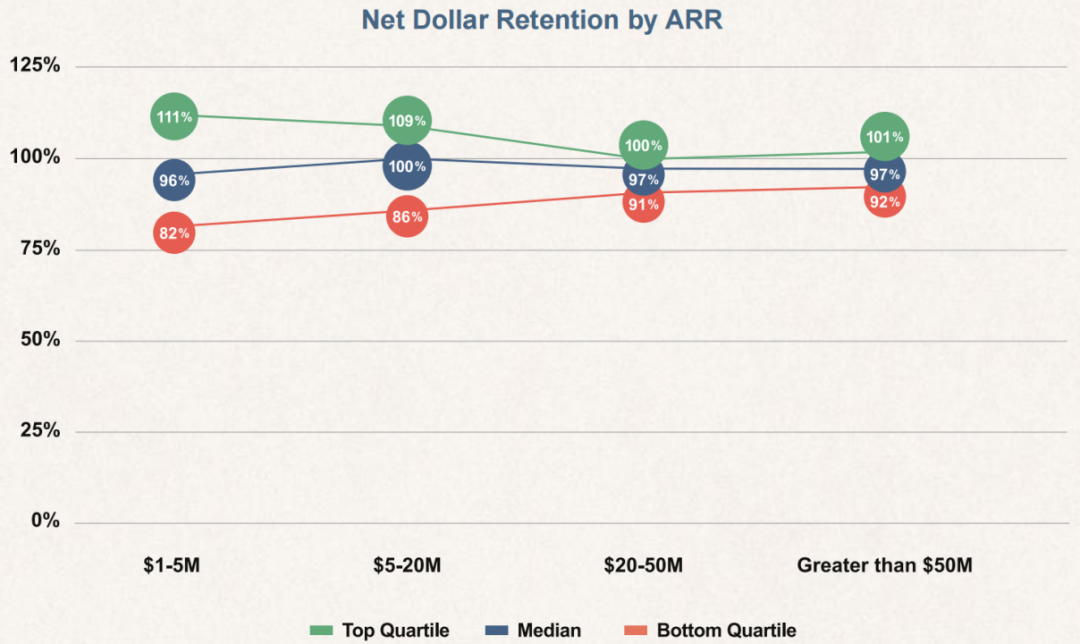
As companies scale, NDR typically trends downward, primarily due to the increasing denominator (total revenue) and gradual saturation of the customer base.
We noted NDR was approximately 15 percentage points lower than in previous years, mainly due to increased churn (accounting for two-thirds), but also partly due to reduced upsell (accounting for one-third). The result was a significant decline in total ARR growth in 2023, demonstrating that NDR is a critical growth driver for later-stage companies.
Products with ACV Between $10K and $100K Have the Lowest GDR
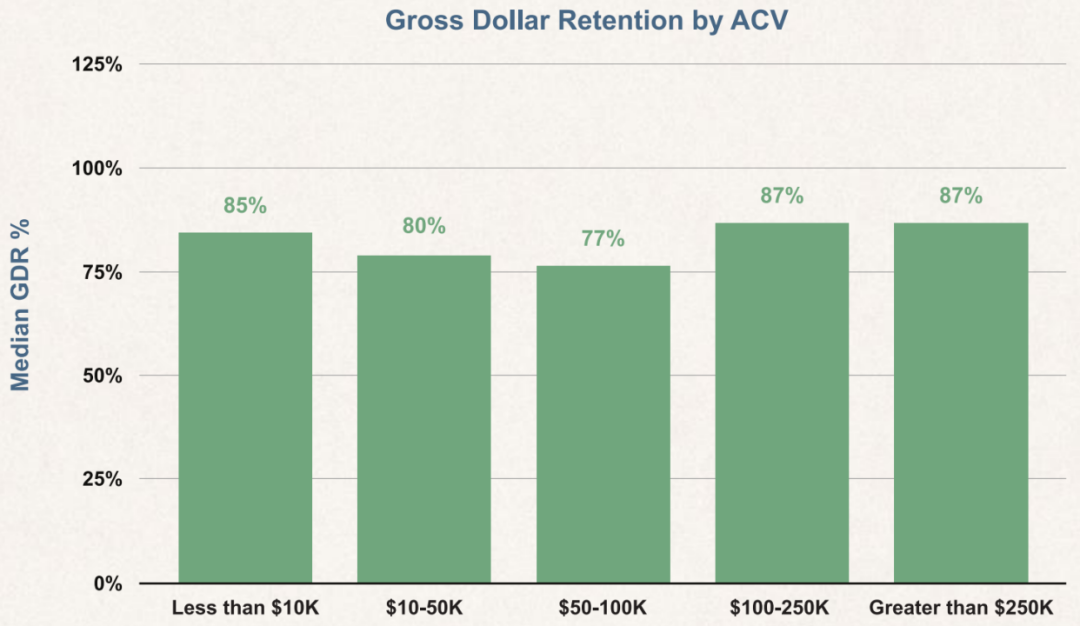
In the 2023 review, companies found that software products priced between $10,000 and $100,000 had the highest churn rates. Although products at this price point generally aren't core systems, cutting them still yields significant cost savings.
Products priced above $100,000 are more likely to be centrally procured and become core systems across the enterprise, hence have higher retention.
Products priced below $10,000 are typically specific solutions for individuals or small teams with more decentralized purchasing authority, making them less susceptible to cost-cutting.
NDR Remains Above 100% for Higher-ACV Products
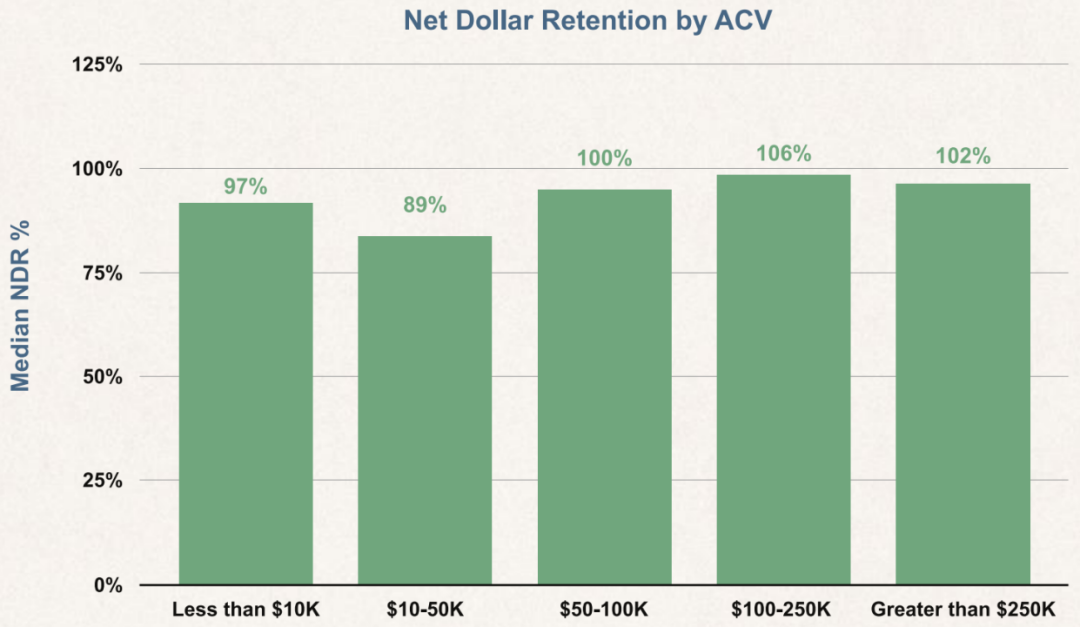
NDR generally increases with ACV. While this trend broadly holds, we found an interesting pattern in the data: for products with average contract value of $50,000 and below, NDR is approximately 10 percentage points higher than GDR; for products with average contract value above $50,000, NDR is approximately 20 percentage points higher than GDR. This indicates that companies with higher average contract values perform significantly better on attach sales, creating a 10-percentage-point gap.
Upsell/Expansion Becomes Increasingly Important as Startups Scale
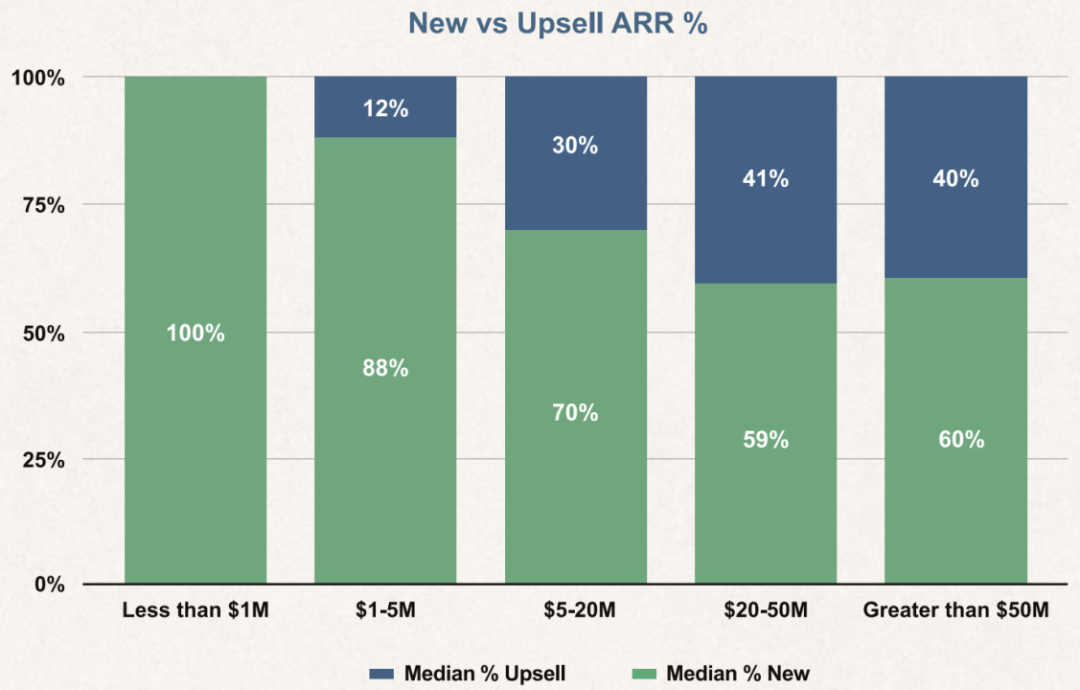
As companies expand, most ARR growth comes from upselling existing customers. Upsell is typically achieved by increasing seat counts, selling additional products, or expanding to new departments/locations.
Given upsell's critical importance to overall growth, we noted that lower NDR has a significant impact on ARR growth rates.
CAC Payback Period Lengthens as Companies Scale
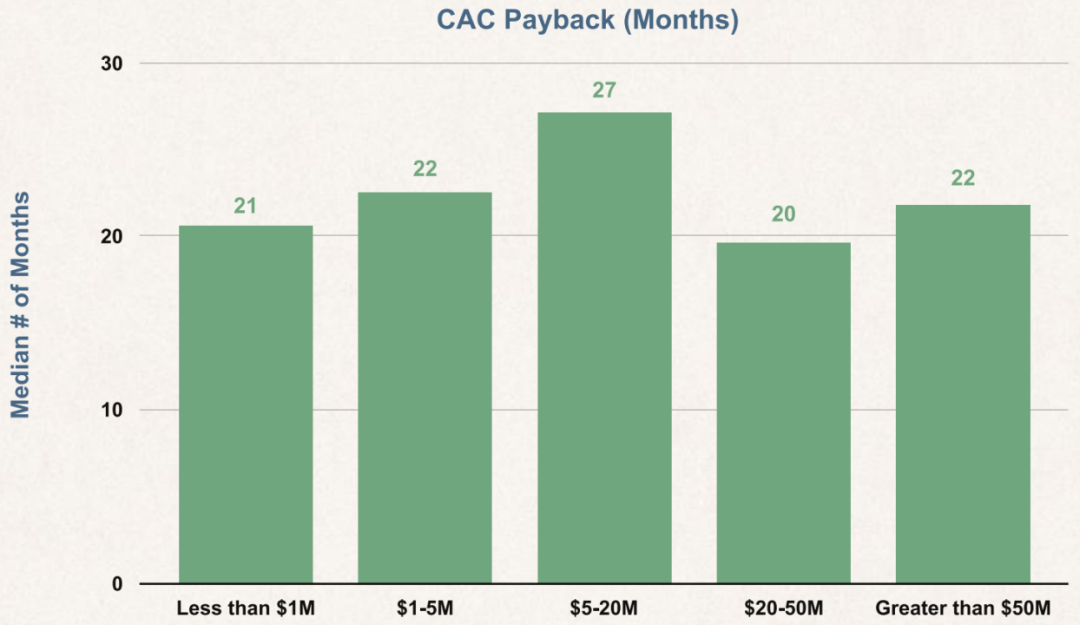
At the early stage, founder-led sales result in lower S&M expenses, but this cost advantage is offset by lower gross margins due to smaller revenue bases. As companies expand go-to-market headcount in the early growth stage, CAC payback period increases accordingly.
Once companies increase the proportion of upsell ARR, CAC payback period tends to decrease because upsell revenue has lower acquisition costs.
Sales Cycle Median Slightly Increased for Customers with ACV Above $25K
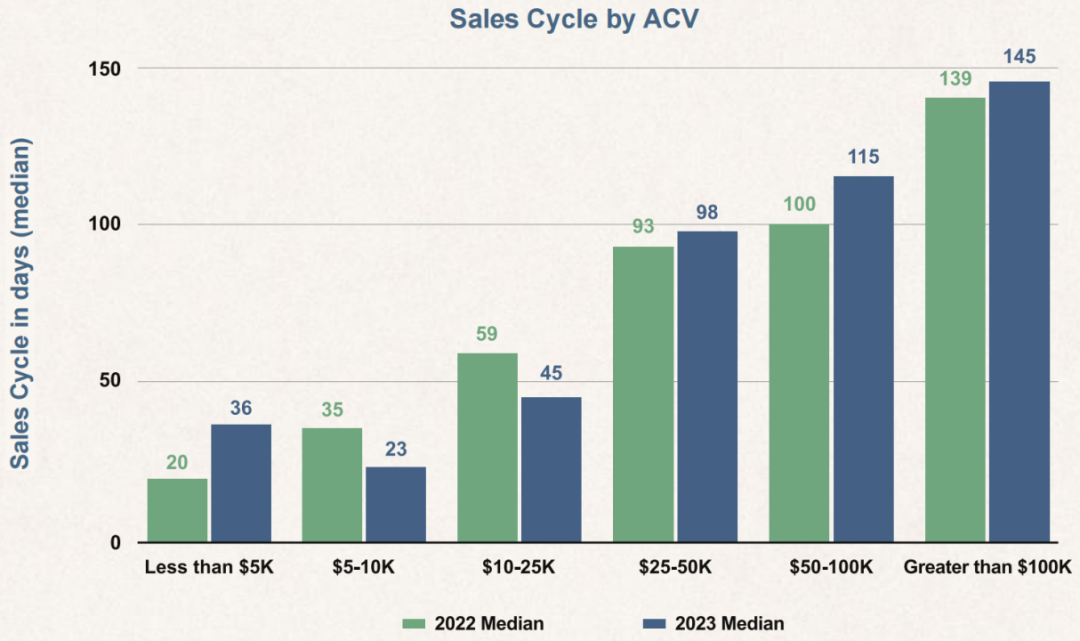
As ACV increases, more buyer stakeholders become involved in the procurement process, extending sales cycles. In 2023, we noted that CFOs began requiring sign-off for purchases above $100,000, directly increasing sales cycles. We also noted more customers preferring proof-of-concept (POC) trials or 90-day opt-out clauses to reduce purchase risk.
While extended sales cycles may have affected deal progression, we did not notice a significant trend in close rates changing. For products with ACV below $25,000, we noted an average close rate of 35% from leads. For products with ACV above $25,000, close rates remained relatively stable at around 25%.
Burn Multiple Gradually Decreases as Companies Scale
Burn multiple is a metric measuring how efficiently SaaS companies generate new ARR from invested capital.
Companies' burn multiples typically decline as they scale, until expansion into new markets is required.
Overall, we noted that burn multiples increased in 2023, as companies set high-growth plans early in the year and adjusted their cost bases in the second half.
ARR per Employee Increases as Companies Scale
Public SaaS companies' ARR per employee:
Top quartile: $389K
Median: $335K
Bottom quartile: $263K
Among companies with ARR exceeding $100 million, top-quartile ARR per employee is $346K, largely consistent with public company data.
Headcount by Department
As expected, early-stage staffing leans heavily toward product and engineering. As companies find product-market fit, go-to-market (GTM) team growth outpaces other departments. Finally, as the customer base expands, administrative and management staffing gradually fills out.
Overall, we noted headcount decreased by approximately 9% year-over-year. Companies with ARR between $20 million and $50 million saw the most significant reductions.
S&M as Percentage of Total Operating Expenses Increases with Scale
As companies scale, sales and marketing expenses exceed general and administrative expenses and R&D expenses.
Average expense allocation for public companies:
G&A: 20% R&D: 32% S&M: 48%
Average expenses as percentage of total revenue for public companies:
G&A: 14% R&D: 23% S&M: 37%
Most Companies Did Not Change Pricing in 2023
Given the challenging macro environment, it's unsurprising that 80% of companies did not change pricing.
Among companies that raised prices in 2023, the average increase was 18%. Early-stage companies raised prices more than later-stage companies.
Early-Stage Companies Are More Optimistic About 2024 Growth Than Later-Stage Companies
For growth-stage companies, 2024 is a critical year. Given the growth challenges of 2023, many companies had to cut spending to weather the storm. These companies project similar growth bottlenecks in 2024 and plan to delay investment until customer demand recovers.
This appears to be the optimal approach. However, their challenge is that venture capital still values growth, and achieving growth without burning capital is difficult. The rise of GenAI technology further complicates this dilemma, requiring additional product investment. Failure to invest in GenAI risks losing market competitiveness within two years.
We believe now is the best time to build era-defining companies, and teams that can navigate today's challenges will have the opportunity to become iconic enterprises of the future.
Translated from Emergence's Beyond Benchmarks**
5Y Capital seeks out, supports, and inspires lone entrepreneurs, providing support from the spiritual to all operational aspects. We believe that if the you whom others see as crazy begins to be believed in, the world will become a different place.
BEIJING · SHANGHAI · SHENZHEN · HONG KONG