Will 2022 Be a Capital Winter? | Li Feng Column

Setting aside emotion, let's return to the facts.
We're halfway through 2022. Over the past six months, many people have been watching the funding environment closely. Affected by regional conflicts, COVID-19, energy, debt, inflation, and other factors, capital markets in China, the US, and Europe have all experienced some degree of volatility this year. In fact, industry voices in both China and the US have revived talk of a "capital winter."
In Q4 last year, US, Hong Kong, and mainland Chinese stocks peaked and began declining in succession. February saw the impact of the Russia-Ukraine conflict, and since March, recurring COVID outbreaks have successively affected key GDP regions in China like the Yangtze River Delta. According to a Wall Street News report in May, the S&P 500 and Dow Jones also saw cumulative declines, with the Nasdaq 100 hitting a milestone low. There is indeed a "chill" in the air.
But if we examine things more carefully, we'll find that the "winter" in Chinese and American capital markets may not actually be the same thing, nor is it necessarily all bad news.
From FreeS Fund's perspective, we've maintained a relatively optimistic stance. In May this year, at an internal FreeS meeting, we established a strategy of "investing in all worthy projects." From March to June 2022, FreeS's new investments and follow-on rounds in portfolio companies were 1.25x the same period in 2021. Even now, when everyone says consumer investment has cooled, we're actually quite active. From Q4 2021 to this June, we made seven new consumer investments (including closed deals and those approved and in closing). By contrast, from Q3 2020 to Q3 2021 — when consumer investment was red-hot — we remained cautious and only made four new consumer brand investments.
This post is the first in our 2022 macro series. In this series, I want to explore with you the changes and fluctuations, situations and opportunities in capital markets in recent years, as well as the reasons behind the divergence between Chinese and American VC.
In this first installment, I'll examine three dimensions — short-term, medium-term, and long-term — to try to answer: In 2022, are Chinese and American capital markets in winter? I hope to offer fresh perspectives and look forward to exchanging ideas with you.
Before diving in, here are a few key points:
- If we compare the two countries' economic cycles to the four seasons, the US is currently at "late autumn heading into winter," while China is more like a "late spring cold snap."
- In the short term, if the US financial system is affected, it will bring relatively large volatility to households and social wealth. By contrast, Chinese household assets are less affected by financial system fluctuations, and China's main sources and supply of social wealth have not suffered major damage.
- In the medium term, the US is at the tail end of a financial cycle; its capital market may contain substantial bubbles, with a longer adjustment period. China's capital market problems, by comparison, are phase-specific. After policy stimulus and market sentiment recovery, it will welcome a favorable turning point.
- In the long term, China's capital market (or primary and secondary market financial instruments) has gradually become the mainstream financial tool for economic development. Stretching the time horizon, China's capital market will grow larger, as will direct financing. The US capital market/GDP ratio far exceeds the Buffett Indicator's measurement range; it can be said to be seriously overvalued.
- Overall, 2022 is not worse than 2020. The recovery elasticity of various macro indicators is better, and stimulus policy intensity is no weaker than in 2020. The overall recovery process will also resemble 2020.
- Over the next two years, whichever country can first achieve relative growth under horizontal comparison will gain global capital favor earlier.
Interactive Giveaway: From your perspective, did Chinese and American capital markets encounter winter in 2022? Share your thoughts in the comments. The 6 most thoughtful commenters will receive a FreeS custom edition of Trends 2030: Eight Megatrends That Are Transforming the World. We look forward to seeking certainty amid change and staying sharp together.


Let me start with an overall conclusion: The US capital market is currently at a point more like late autumn heading into winter, with a longer adjustment and recovery cycle. China's capital market, meanwhile, is experiencing something more like a late spring cold snap, with a relatively shorter adjustment and recovery cycle.
To explore the differences in "chill" between the two countries' capital markets, we need to set aside emotion, return to facts, and compare important differentiating factors in the present, medium term, and long term.
Short-Term Factors
▎The financial system has large impact on US households and social wealth, but small impact on Chinese households and social wealth
"Capital winter," as the name suggests, means less money in capital markets. So, have the two countries seen large-scale wealth destruction effects?
At present, US financial system impacts bring relatively large volatility to households and social wealth. Chinese household assets are less affected by financial system fluctuations, and China's sources and supply of social wealth have not suffered major damage.
Why do I say this? Let's look at household asset composition in both countries.
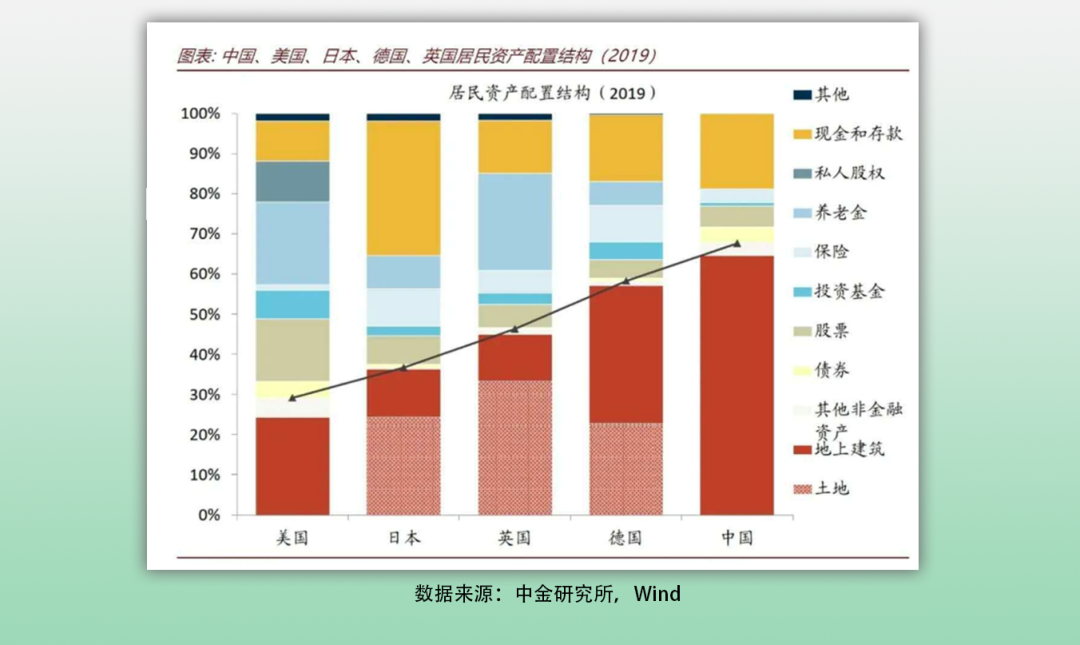
Based on 2019 data from the Federal Reserve, US Treasury, and People's Bank of China, Chinese residents' asset allocation is dominated by residential property, accounting for over 65%. Financial assets have increased in recent years but remain relatively low at just 20.4%. US residents' asset allocation is dominated by financial assets — equities, insurance, pensions, investment funds, stocks — accounting for over 50%, with residential property at only 23%.
To some extent, the proportion of household financial assets in total asset composition determines how much household assets are affected by financial system fluctuations. Put simply, because financial assets make up a larger share of US household asset composition, financial crises or market turmoil have a much greater wealth destruction effect on US households than on Chinese households.
What is fairly certain is that China has not yet seen large-scale wealth destruction effects. Here, wealth refers to the entire society's foundational wealth, including household wealth, corporate wealth, and government wealth.
On May 13, the PBOC's April 2022 financial statistics report showed that household loans — consumption loans, housing loans, and business loans — all decreased simultaneously, reflecting that demand reduction driven by confidence issues is objectively real.
However, while loan balance growth has slowed, from January to April 2022, both household deposits and non-financial corporate deposits saw year-on-year increases in new additions. The increase in deposits held by households and non-financial enterprises has many causes. One important reason is that large-scale wealth destruction effects have not yet occurred.
This is because Chinese household wealth remains primarily composed of real assets, with real estate as the main component.
On the household side, if the real estate industry sees more systemic price problems — not just fewer people buying homes, but significant property devaluation — households could face large-scale wealth destruction effects.
Before 2016, real estate served as the "ceiling" for China's economic growth, long playing the locomotive role in driving economic expansion. But starting in 2016, China stopped using real estate as a counter-cyclical adjustment tool and instead made it a long-term regulatory target, establishing "housing is for living in, not speculation" as the regulatory tone. Today, with real estate no longer the main engine for economic growth, it has become something of a "floor" for China's economy — the economic chassis — because of its massive scale and its role as the main component of Chinese household wealth.
Although the stock market has experienced relatively violent fluctuations over the past three quarters, as I just mentioned, the impact of financial assets on Chinese household wealth in terms of overall social wealth may not be as large as people imagine.
▎Why did Chinese and American capital markets fall? Liquidity factors VS phase-specific factors
Both Chinese and American capital markets have seen varying degrees of decline this year. What are the reasons?
Here's the preliminary conclusion: US capital market declines are driven by liquidity factors stemming from monetary and fiscal policy. Chinese capital market declines are mainly driven by phase-specific factors including policy, COVID-19, and regional conflicts. Therefore, the performance and corresponding adjustment strategies of the two countries' capital markets differ.
To explore why US capital markets fell, let's first consider when US stocks rise. Historically, US stocks have turned from decline to rise over longer periods mainly based on two scenarios:
-
Improved US economic fundamentals combined with technological innovation, restoring corporate profitability, with data supporting higher market expectations for earnings fundamentals.
-
The Federal Reserve adopting long-cycle quantitative easing to release liquidity, and using reverse repos and other tools to drive US stock returns.
But over the past twelve years, the prosperity of US financial and capital markets hasn't been entirely because companies got better or because there were more good companies. Rather, a massive liquidity bubble inflated asset prices.
To promote economic recovery, the Fed pushed money printing, direct payments, and tax cuts to their limits. By 2021, US corporate bonds had ballooned to $10 trillion, with most flowing into the stock market, driving record corporate buybacks. Large-scale debt-funded buybacks appeared to boost stock prices but didn't drive substantive corporate development.
In 2020, the Fed's global flood-like response to COVID-19 created massive inflation, accelerating rate hikes. With high interest rates, large-scale maturing Treasuries since 2021 have struggled to roll over, and even when they can, borrowing costs exceed large enterprises' growth rates or dividend yields. Capital markets face bubble-bursting and cyclical recession crises, with deleveraging again imminent. Meanwhile, before Q1 2022 rate hikes, US stocks saw another buyback wave in a final window of opportunity. Goldman Sachs data shows that Q1 2022 approved stock buybacks hit another record, exceeding $300 billion.
We can see a paradoxical phenomenon: during the 2020 pandemic, most US enterprises suspended operations, yet securities markets kept rising, with the S&P hitting a historic high in January 2022. This illustrates from another angle that US stocks have diverged from social fundamentals.
Earlier, we noted that US household balance sheets are heavily weighted toward financial assets like equities, giving capital strong mobility. When the Fed stimulates, the effects typically transmit quickly to markets. But at the tail end of a financial cycle, with inflation running hot, the Fed's reactive strategy of aggressive rate hikes and balance-sheet tightening forcibly drains market liquidity, raises corporate financing costs, further constrains funding access, and amplifies equity volatility — delivering yet another jolt to asset bubbles.
Signs of a bursting US asset bubble are already emerging. According to a May 25 Wall Street News report, the S&P 500 has fallen more than 20% year-to-date, while the Dow Jones has dropped nearly 14%. The first 100 trading days for both the S&P and Dow are on track for their worst start since 1970, and the tech-heavy Nasdaq-100 has hit historic lows.
Now turning to China. In March 2022, Beijing set a full-year GDP growth target of 5.5%. But the first half brought successive shocks: external headwinds from the Russia-Ukraine conflict and internal disruption from the Omicron outbreak.
The external shock, though already underway before the Government Work Report was released, persisted longer and cut deeper than most had expected at the year's start. The internal shock came after the report's publication. Compared with the external pressure, the domestic blow was more sudden and more severe. As mentioned earlier, the government has been deploying stimulus measures — including massive issuance of local special-purpose bonds — to defend the economic base and drive elastic growth.
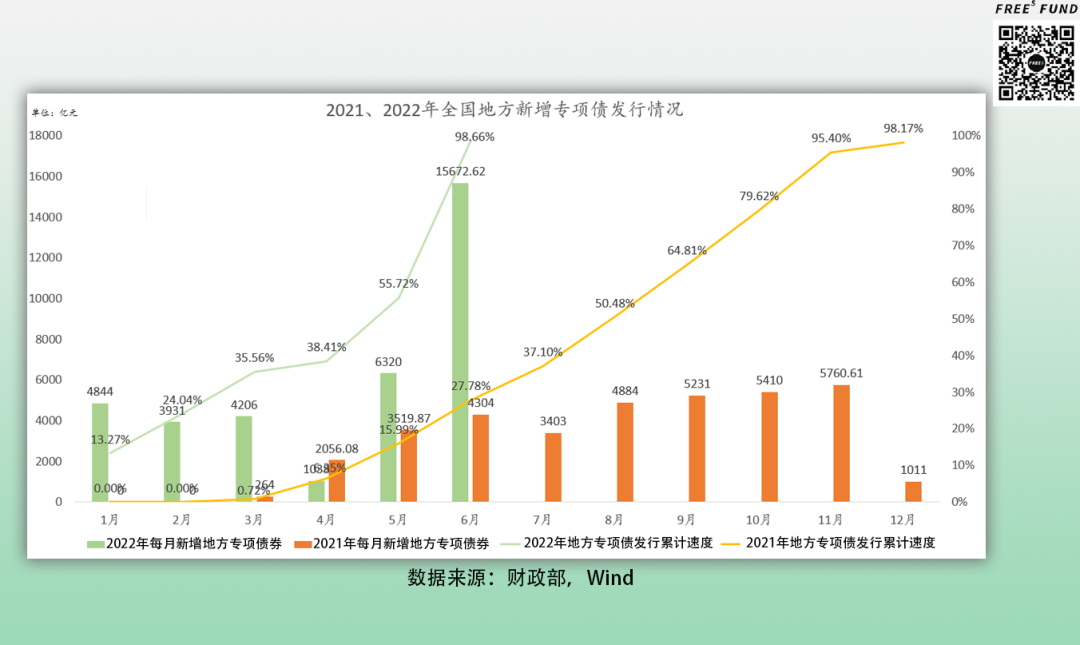
Overall, China's approved special bond quotas for 2021 and 2022 were roughly equivalent. But a closer look at the cumulative issuance curves reveals a telling difference: 2021 showed steady, gradual acceleration throughout the year, while 2022's curve suddenly spiked in May and June. What does this indicate?
Governments typically front-load special bond deployment because funds take one to two quarters to feed through to stimulus and growth. The intensified push in May and June, and the effort to exhaust quotas in the first half, should help fully support second-half expansion.
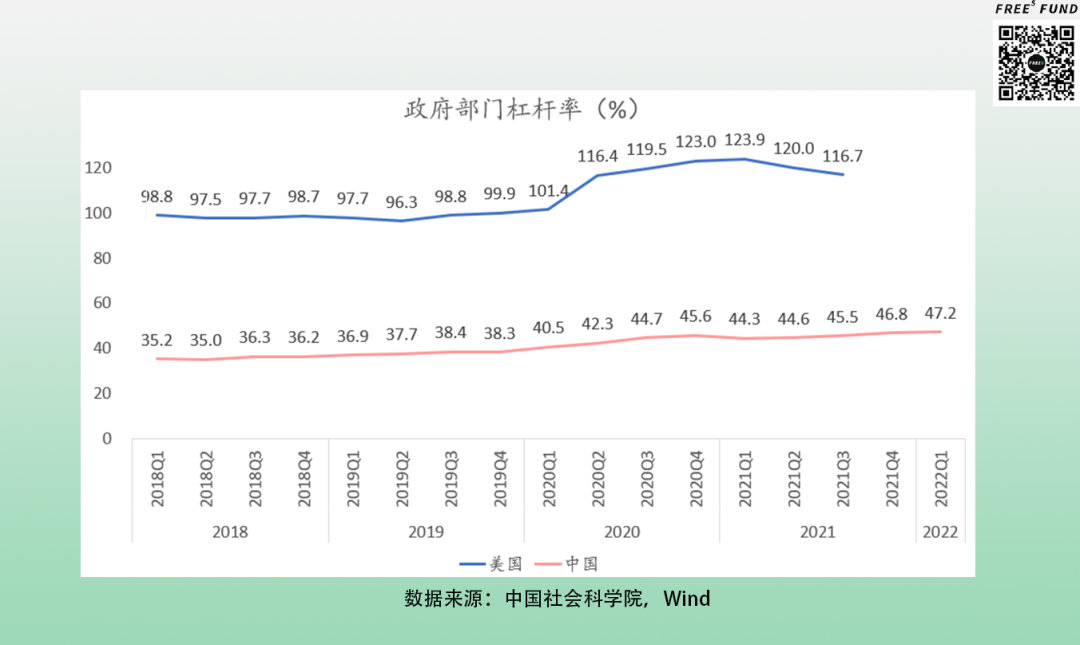
It's also worth noting that when COVID-19 struck in 2020, most major economies adopted monetary easing far exceeding that of the 2008 financial crisis. China, by contrast, did not pursue aggressive monetary policy.
Since Q2 2020, US government leverage peaked at 123.9%, while China's stayed in a 40%–47% range from Q1 2020 through Q1 2022. This means we have ample debt capacity and fiscal policy room relative to the US.
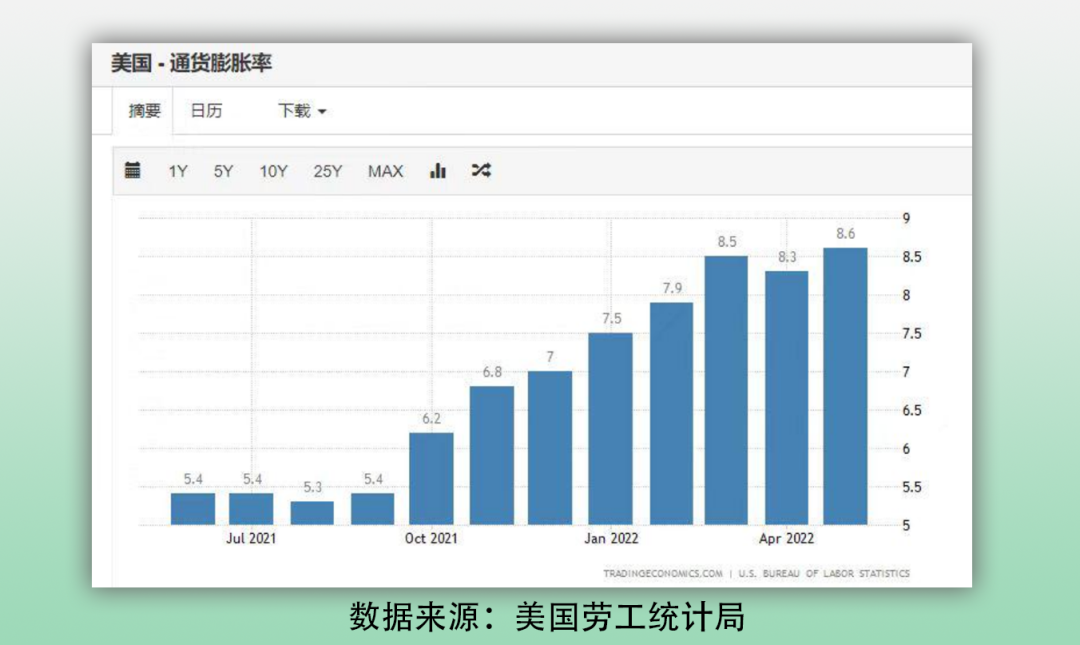
Additionally, both countries face inflation pressure domestically and internationally.
US data for May showed inflation at 8.6%, up slightly from April's 8.3%, reaching a historic high and exceeding market expectations of 8.2%–8.4%.
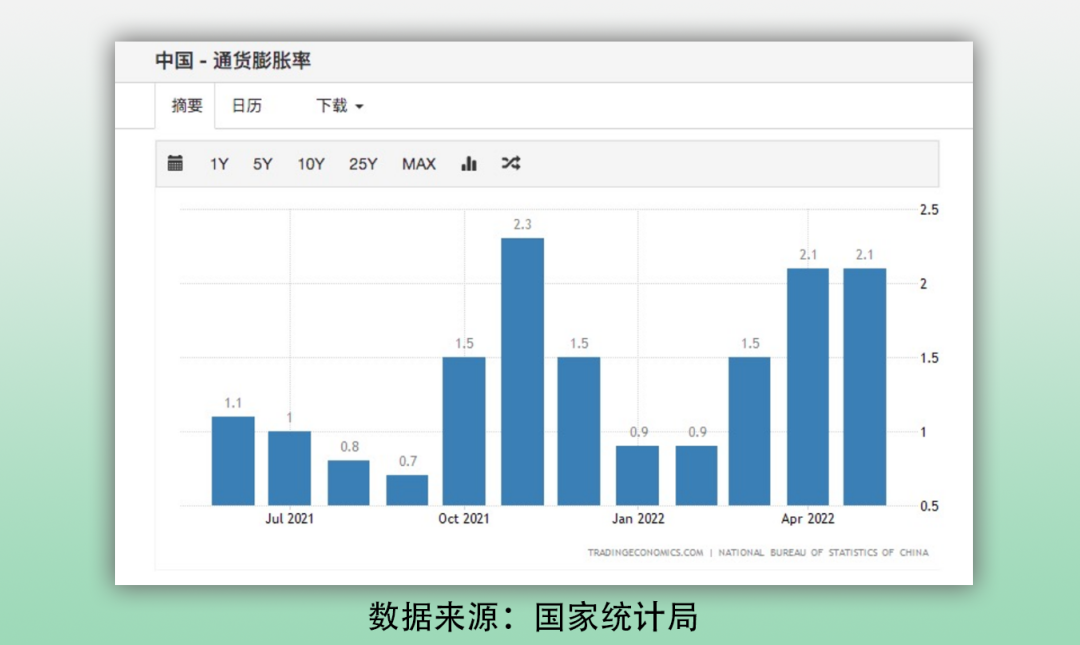
China is also facing some inflation pressure, with the rate rising since the end of Q1. On the positive side, we have multiple countermeasures: our exceptionally long industrial chain can absorb inflation across many stages; and our purchasing costs for bulk commodities are relatively low, saving on input expenses.
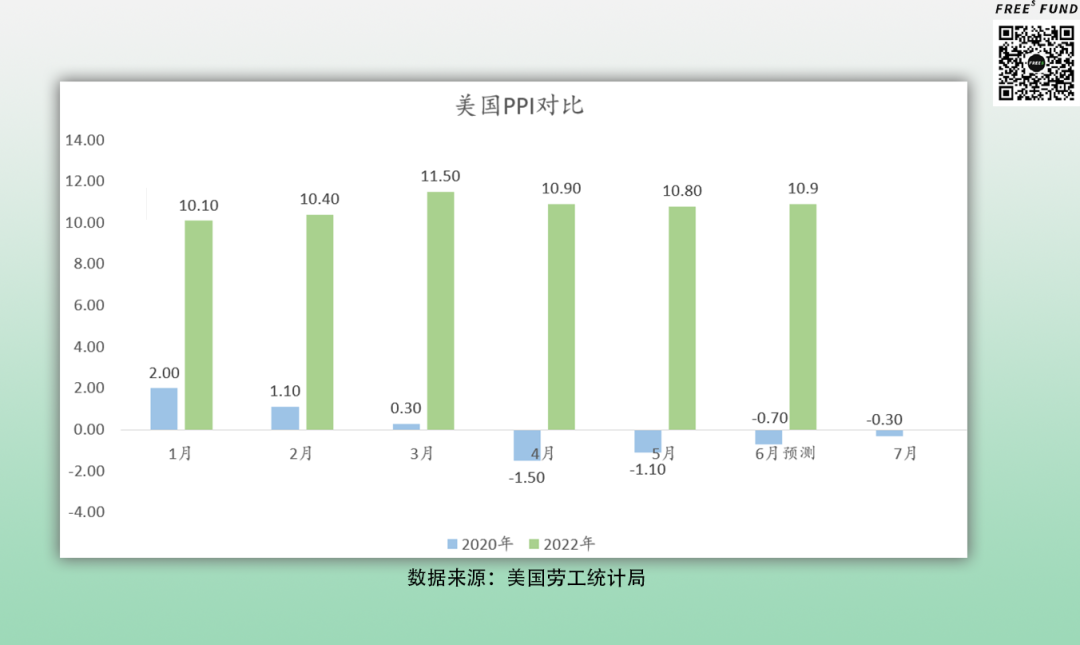
We can also examine two key inflation indicators for both countries: the Consumer Price Index (CPI) and Producer Price Index (PPI).
CPI typically reflects market economic activity and government monetary policy. Economists generally define CPI growth above 3% as inflation, and above 5% as relatively severe. Significant CPI acceleration signals serious inflation and is generally unfavorable for growth. PPI, or the producer/product price index, is commonly used to gauge international inflation.
Normally, international price inflation at the materials level (PPI) transmits through the supply chain to push up consumer goods prices (CPI). Data shows both countries felt international inflationary effects in 2022, with rising commodity and energy prices driving year-on-year PPI increases from Q1.
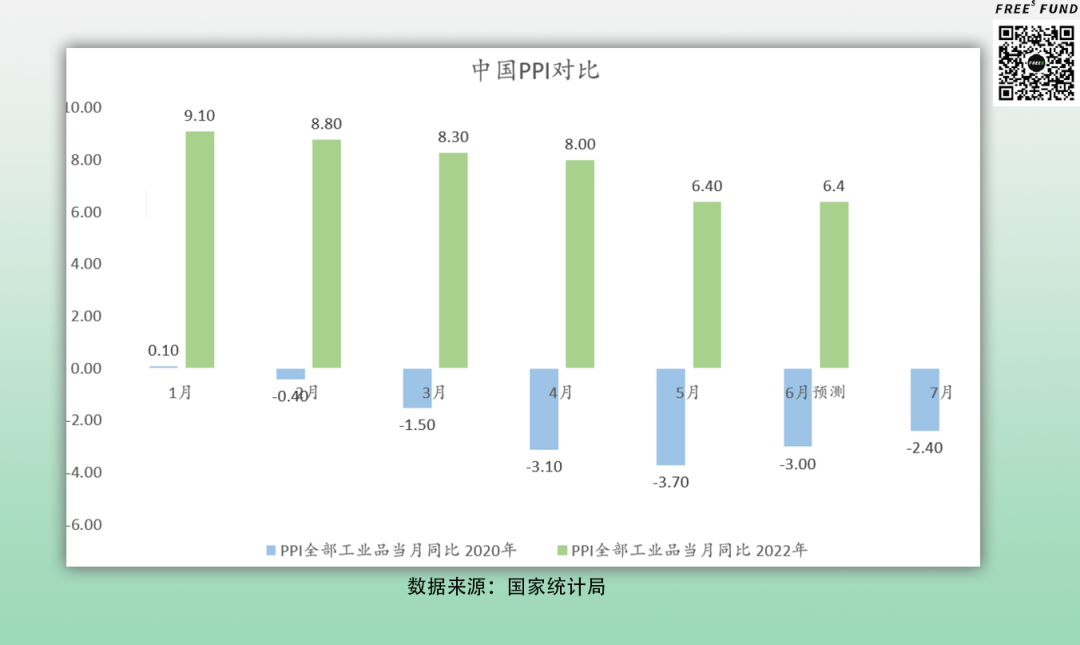
But thanks to rapid regulatory intervention on commodity and energy prices, China's PPI moderated in Q2. Another important factor in this retreat: our exceptionally long industrial chain, which can absorb inflationary pressure across multiple stages.
US PPI also saw noticeable year-on-year growth in Q1 and Q2 2022, remaining elevated overall but stabilizing from Q2 onward.
But if we continue to the two countries' CPI readings, some interesting patterns emerge. Despite elevated PPI levels early in 2022, China's terminal CPI growth remained relatively muted, showing clear retreat from 2020 levels and limited pass-through from intermediate goods prices.
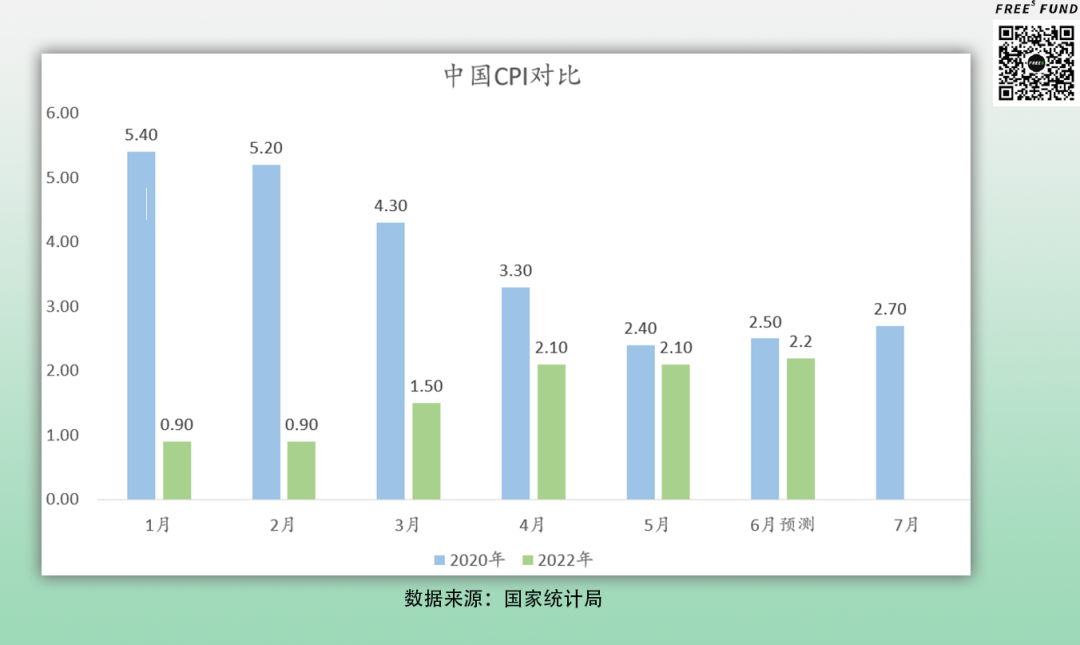
This partly reflects China's CPI composition, which is dominated by agricultural prices, while PPI is driven mainly by industrial raw materials — creating weak transmission from PPI to CPI. It also reflects our long industrial chain digesting PPI increases before they reach consumers.
Turning to US CPI: the latest June release from the Department of Labor showed May consumer prices rising 1.0% month-on-month and 8.6% year-on-year — a 40-year high, with growth tracking almost in lockstep with PPI trends.
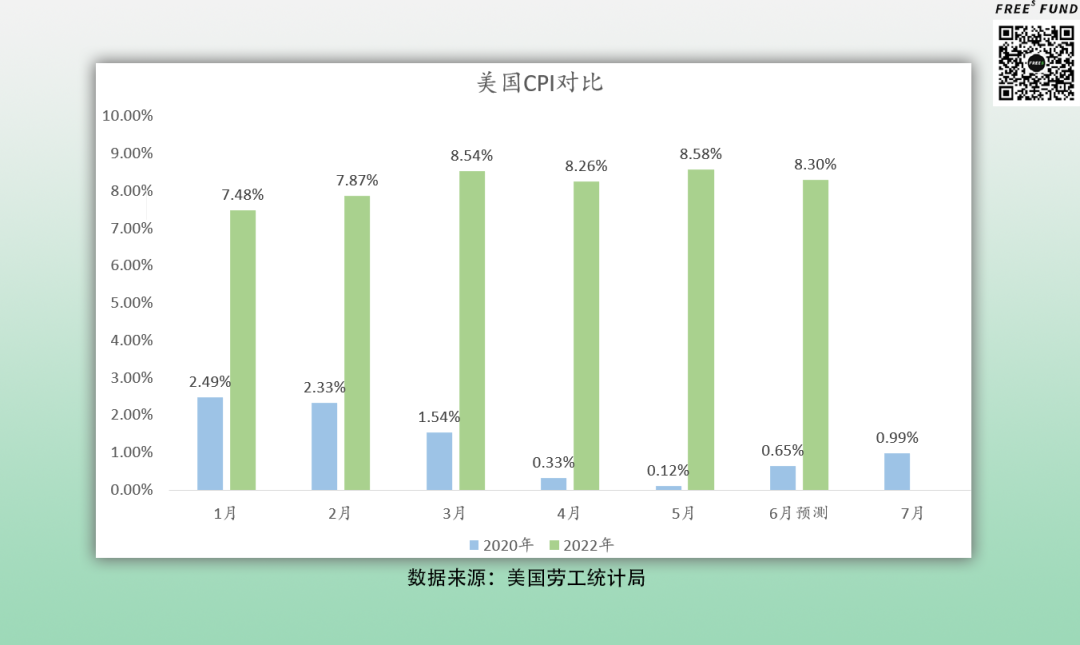
This pattern stems from two factors. First, the Fed's unprecedented flood of liquidity in 2020 to combat COVID inflated global asset price bubbles and reopened the door to runaway inflation. Second, unlike China, the US implemented little policy intervention on PPI, allowing most of the increase to transmit through to CPI and drive consumer goods prices higher.
From this, we can at least infer that if the internal chain-reaction shocks from COVID largely subside in the second half and stimulus measures take effect, China's economy should recover relatively quickly. And given China's comparatively strong capacity to absorb and adjust to inflation, we may well see foreign trade post solid or even above-expectation growth in H2.
Medium-Term Factors
Having surveyed the immediate state of both countries' capital markets, let's extend the timeframe and examine volatility drivers through the lens of medium-term structural differences.
From the current vantage point, the US sits at another financial cycle tail end, with capital markets potentially facing massive bubble-bursting risk. China's capital markets face difficulties too — mainly from recurring COVID impacts on markets and sentiment, plus external shocks from international disputes. But historically, policy stimulus has generally paved the way for recovery within a reasonable horizon.
US: Accumulated Bubbles from Past Cycles May Burst
A financial cycle refers to periodic fluctuations driven by the expansion and contraction of market financial variables; the end of such a cycle is called the financial cycle tail.
In American economic and financial history, there have been three complete financial cycles, each ending in major economic crises: the Great Depression of the early 20th century, the savings and loan crisis of the late 20th century, and the subprime mortgage crisis of the early 21st century.
These crises typically stem from some combination of monetary policy tightening and loosening, regulatory regime changes, credit expansion and contraction, and financial innovation within a given cycle.
To illustrate how policies within a financial cycle create cascading effects, let's focus on the third US cycle of the early 21st century. Following the subprime crisis, America deployed a series of monetary and fiscal measures to stimulate recovery, setting off a chain reaction of consequences.
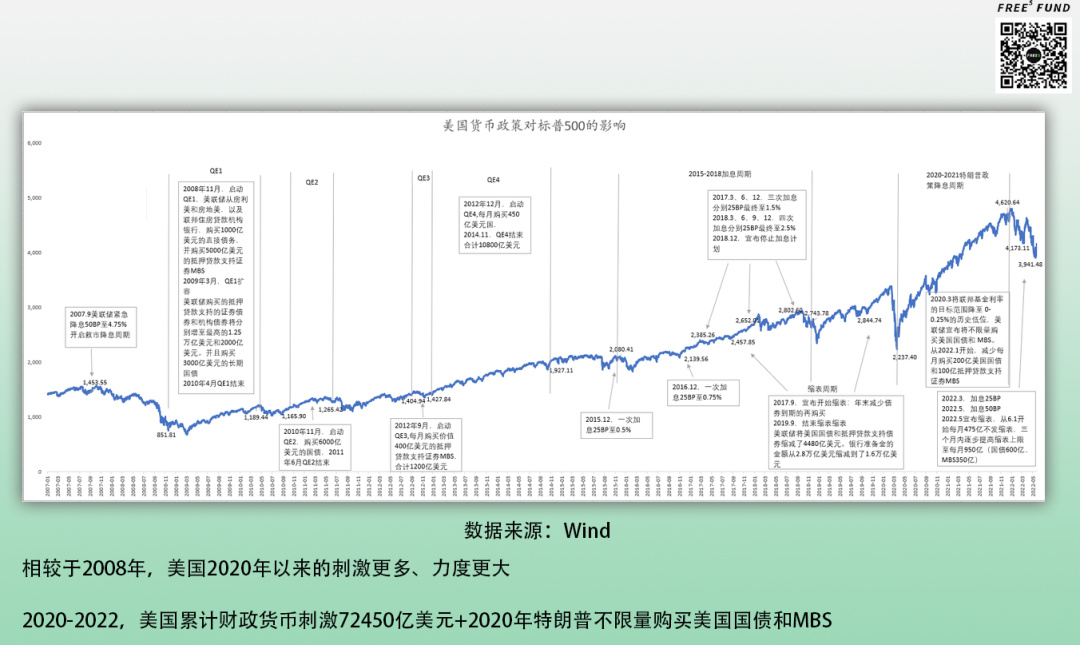
In 2007, America's capital markets were inflated largely by a real estate bubble. When that bubble burst, the financial crisis followed. To stimulate recovery, the Obama administration poured massive funding into large-scale economic stimulus programs. The Federal Reserve not only cut the federal funds rate to 0%–0.25%, implementing a zero-interest-rate policy, but also rolled out three consecutive rounds of quantitative easing (QE) from late 2008 through November 2014.
Subsequently, the Fed launched QE2 from November 2010 to June 2011, QE3 from September to November 2012, and QE4 from December 2012 to November 2014. Throughout the QE implementation period, US stocks generally trended upward.
In terms of purpose, quantitative easing aimed to reduce corporate borrowing and financing costs, stimulate consumption, support economic growth, and avoid deflation risks. However, prolonged, unlimited QE could also breed asset bubbles, drive up inflation, and plant the seeds of future financial crises — whether the stock market bubble of the 1920s, the dot-com bubble of the 1990s, or the real estate bubble of the early 21st century. And the several rounds of QE that the Fed began in 2008 seemed to produce similar results.
According to Reuters, in the first quarter of 2021, US junk bond sales hit record levels, and American stock markets showed signals of entering a highly speculative phase. That same year, the S&P 500 approached all-time highs, Reuters reported. Inflation indices published in May also continued rising above market expectations.
All these phenomena suggest that after the叠加 (stacking) of four rounds of quantitative easing from 2010 to 2018, followed by unlimited QE in response to the external shock of COVID-19, US stocks have developed enormous bubbles. And now, these bubbles could burst at any moment — influenced by yet another policy shift. After halting quantitative easing, the Fed has entered a cycle of rate hikes and balance sheet reduction.
As the US economy gradually adjusted, from April 2015 to December 2018, facing rising national debt and inflation, the Fed gradually wound down its quantitative easing policy and moved into a rate-hiking and balance-sheet-shrinking cycle, attempting to normalize monetary policy.
To put it simply, the Fed's rate hikes involve raising the federal funds rate, a move that primarily benefits commercial banks' profit margins. Balance sheet reduction, or "shrinking," involves selling government bonds and MBS and other instruments to withdraw the currency issued during the QE period. This typically creates funding shortages in markets, with massive impact on money market liquidity, US stocks, and US bonds.
From December 2015 to December 2017, the Fed raised rates five times. When the real economy is performing well, Fed rate hikes and balance sheet reduction can be seen as routine market regulation. But this round of tightening looks more like a passive, short-term emergency measure by the Fed in the face of an ever-expanding balance sheet, stagnant economic growth, and inflation — implemented at a very high frequency.
And at this point, US stock markets were saturated with the residual bubbles from the tail end of the financial cycle. The Fed's frequent, unbuffered rate hikes and balance sheet reduction in recent years risk puncturing these bubbles, triggering a series of capital market crises whose adjustment and recovery could take a considerable amount of time.
China: The Impact Won't Be Especially Lasting; Likely a "Fast In, Fast Out"
China's current situation is rather different. Our economic fluctuations over the past three years have all been somewhat connected to the pandemic, and they show certain similarities in pattern.
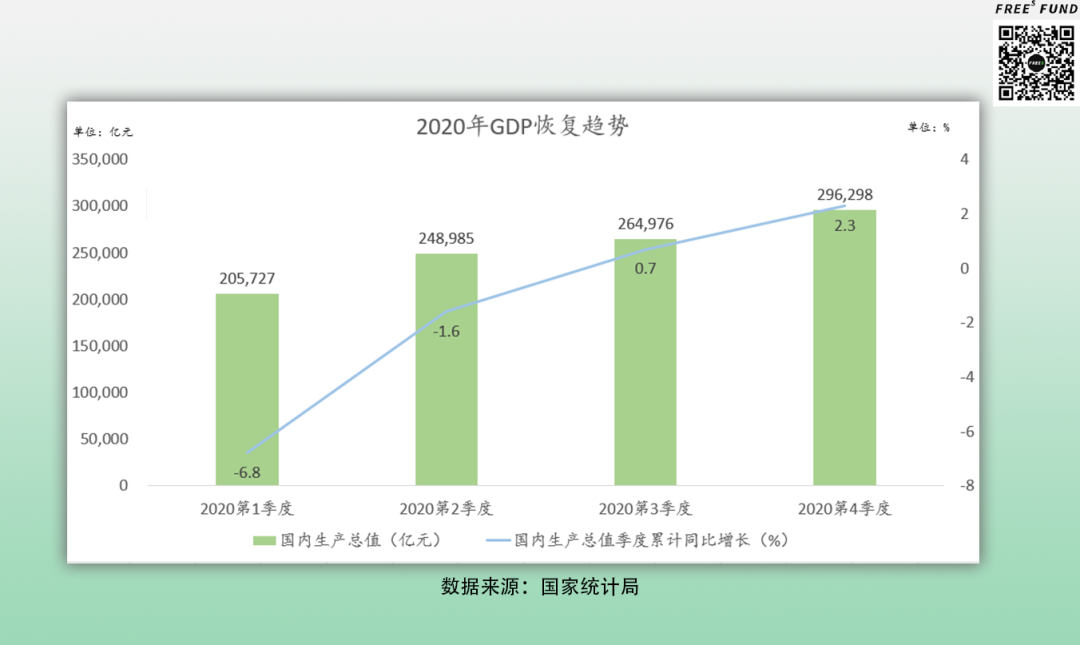
When COVID-19 broke out in early 2020, our economy took a hit. First-quarter GDP fell 6.8% year-over-year, the lowest quarterly GDP reading since 1992, and unemployment climbed steadily. Wuhan lifted its lockdown on April 8. Looking at the economic data, around May the country entered a "new normal." The national economy gradually recovered, with GDP turning from negative growth in Q1 and Q2 to positive territory.
This turning point came not only from domestic COVID policies that proved highly effective, but also from an inflection in public sentiment — we began learning how to travel, live, and work during the pandemic. Accompanied by this "new normal" premised on Wuhan's reopening, China's economic development gradually returned to normal in the second half of 2020, and confidence gradually recovered. Stimulus policies also helped pull the economy back.
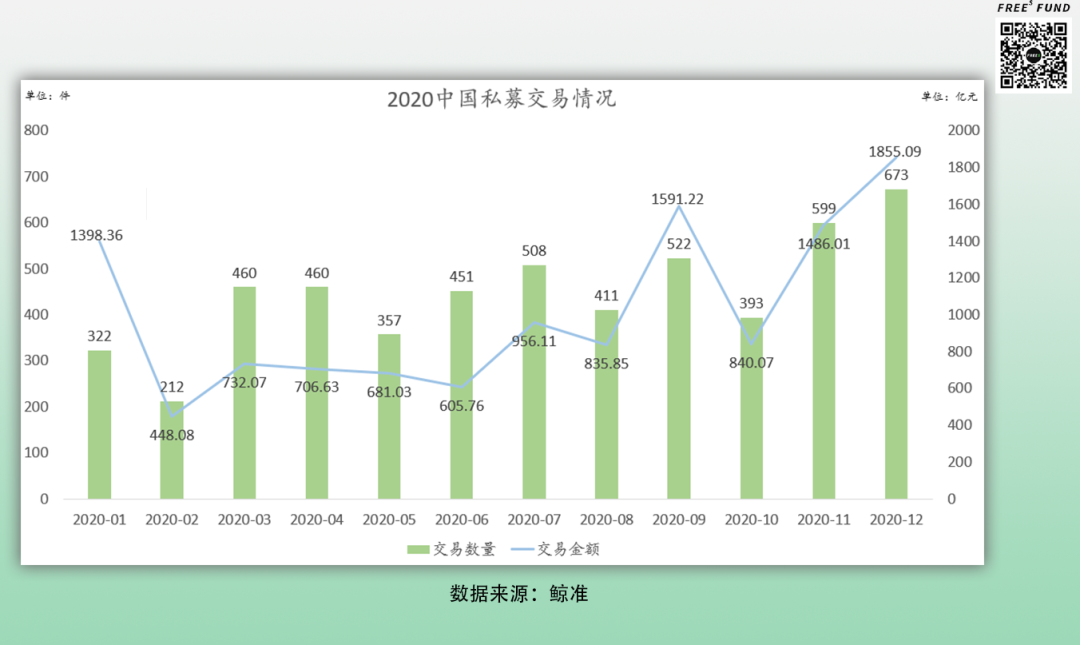
Under the dual stimulus of economic conditions and policy, as the national economy gradually recovered, the primary market also showed some new signs.
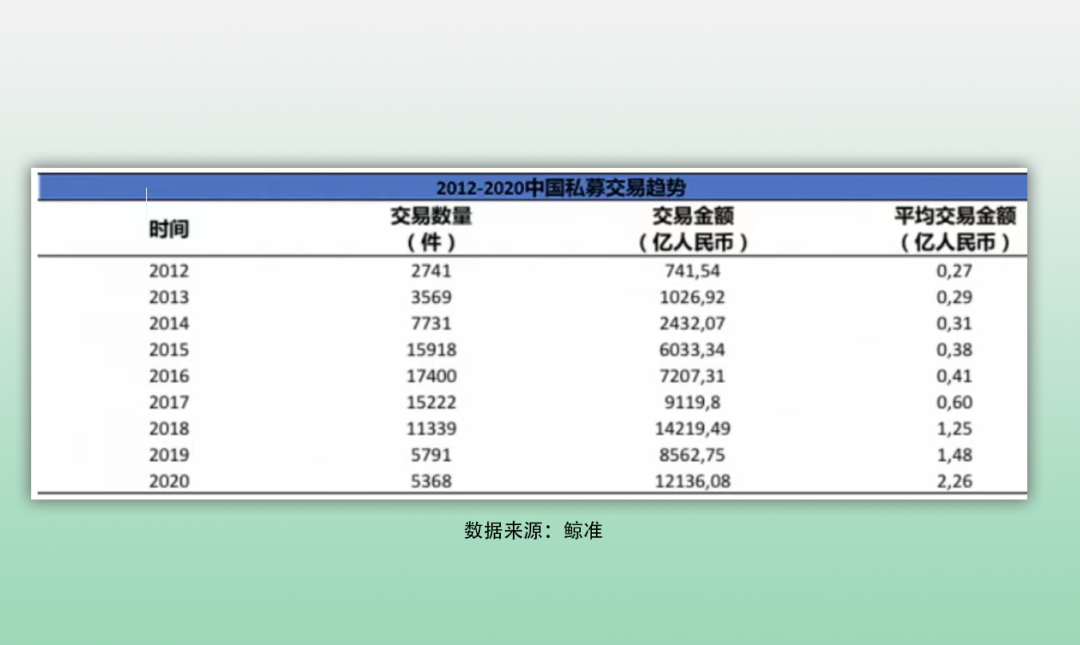
Although in early 2020 everyone was discussing "funding winter," and early-stage investment deal volume and value did drop sharply compared to 2019, the transaction data revealed something behind the "funding winter": quality companies were commanding higher premiums. In 2020, the average primary market deal reached 226 million yuan, again hitting a new record high.
Flash forward to 2022: China's capital markets experienced another round of volatility, with the A-share market falling consecutively and the primary market again seeing "funding winter." Beyond external factors like the Russia-Ukraine conflict and Fed rate hikes, this also related to COVID flare-ups in China's major economic cities.
How long will this volatility and weakness last? I'm inclined to see it as short-term, and the government has already reverted to stimulus policies. According to National Bureau of Statistics data, as of end-May, the first two quarters of 2022 saw stimulus measures no less aggressive than 2020's, aimed at supporting the economy. This year's fiscal stimulus is no smaller than 2020's, and more cash-flow-oriented.**
Although June data isn't out yet, I'm relatively optimistic in predicting that this pandemic "new normal" began in June.
**We're already seeing some signs. Shanghai moved from formal reopening in early June to allowing dine-in service by late June, with major attractions gradually resuming normal operations. Then there's the official announcement these past couple days removing the "star" mark from the digital travel code. Entry and exit controls across cities nationwide are gradually easing.
In 2020, elastic consumption recovered relatively slowly — total retail sales of consumer goods didn't turn positive until Q3 and Q4. Given the reduced severe illness and mortality risk from the Omicron variant, consumption recovery this year may prove more elastic than in 2020. By "elastic," I mean the growth rate of consumption recovery once the factors suppressing it are brought under control. The faster the recovery, the better the elasticity.**
**Let's compare the macro data from February and March 2020, when performance was poor, with April and May 2022, similarly weak. The commonality: during both periods the country was under significant pandemic impact, and from both time points onward, recovery signs appeared.
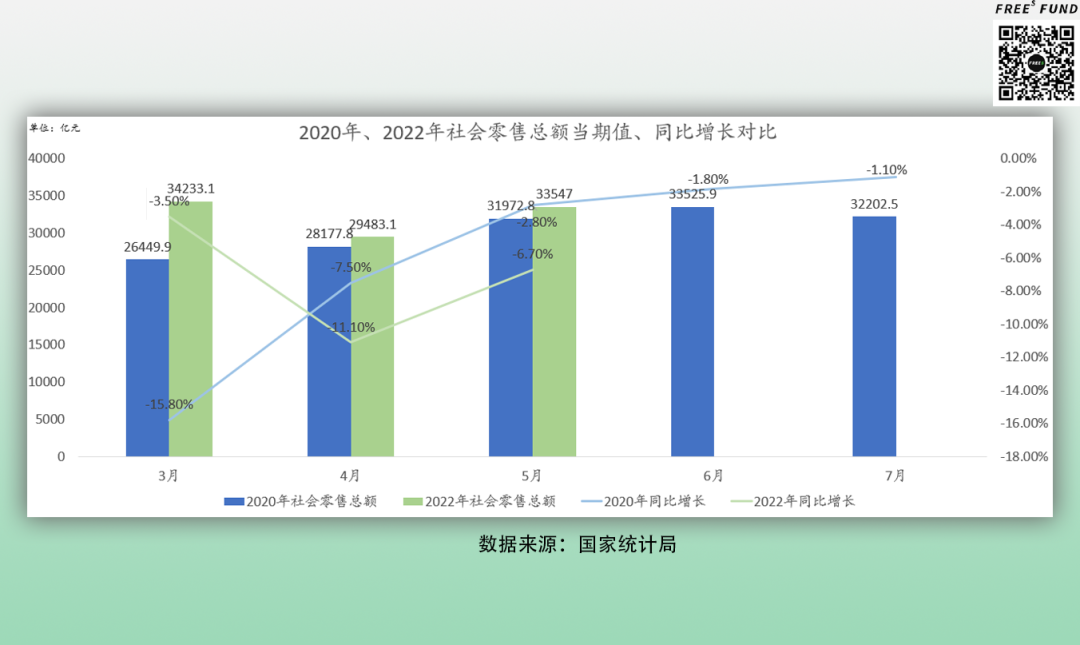
First, total retail sales. In 2020, retail sales showed clear growth starting in March and April, then flattened in Q3 and Q4. In 2022, March retail sales saw a more pronounced drop, then began positive recovery in April and May.
But if we compare horizontally, whether in absolute scale (shown as bar length in the chart) or year-over-year growth rate, April and May 2022 retail sales were no worse than March and April 2020.
Next, foreign trade exports. Even at April 2022's low point, export value year-over-year growth was still roughly comparable to the same period in 2020, and the slope of recovery — what we call elasticity — was also relatively good. And compared to 2020, 2022 export values were larger in total scale.
Some might wonder: in the first half of 2022, Shanghai — China's largest container port — was affected by the pandemic, so why weren't export values more severely impacted? To answer this, let's look at the chart below.
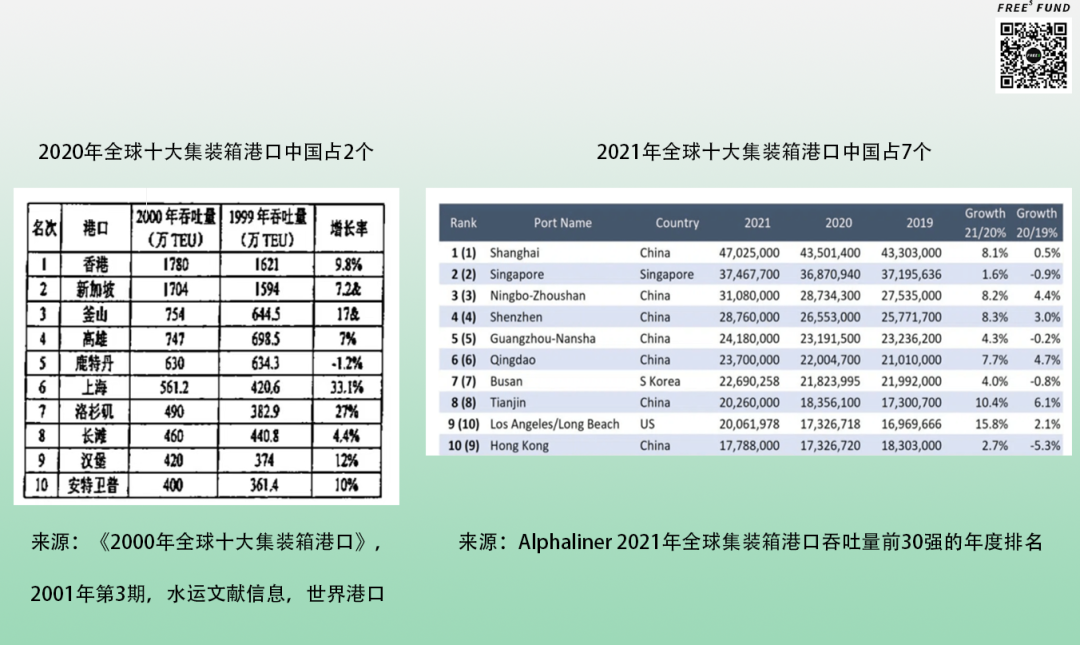
As of 2021, China held seven of the world's top ten container ports. So although the first-half pandemic constrained logistics in the Yangtze River Delta and Pearl River Delta regions, other cities' ports could effectively分担 (share) foreign trade logistics pressure, also supporting export growth in the second half.
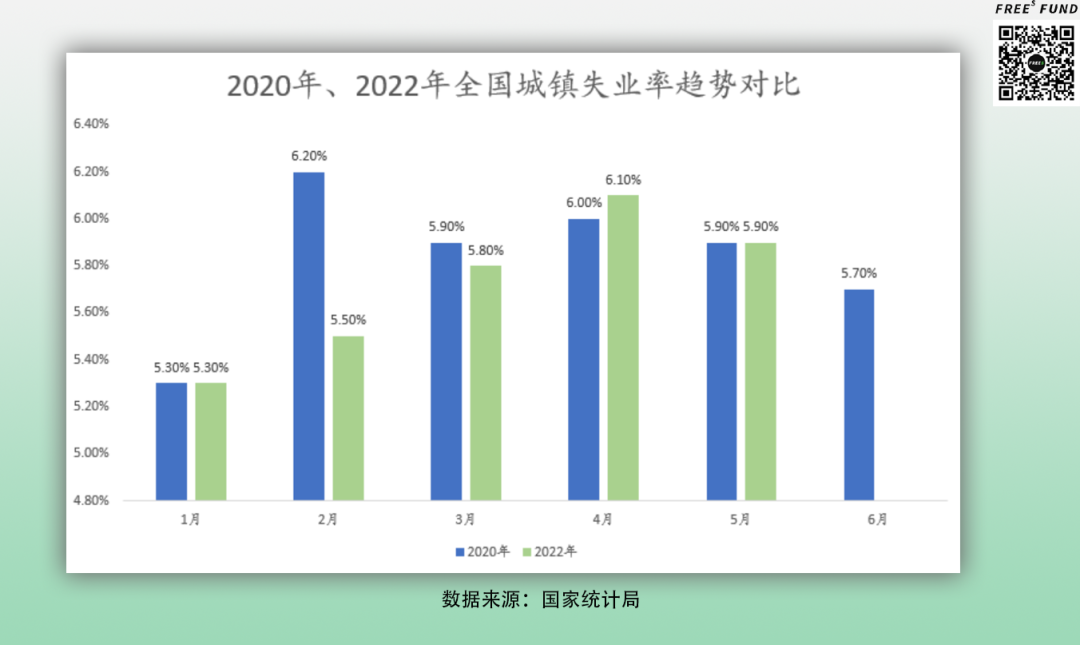
One more data point people care about: unemployment. Data shows that in April 2022, the national urban surveyed unemployment rate rose 0.3 percentage points to 6.1%, possibly another high since February 2020. But in comparison, April and May 2022 were at least slightly better overall than February and March 2020, and we may have already passed the unemployment peak.
However, one challenge in this round of economic recovery is actually investor confidence. Compared to the macro indicators above, the investor confidence index is a relatively "soft" indicator, but it's also quite important for market recovery.
Because people typically prioritize concerns in this order: safety, survival, then feelings, development, opportunity.
Take the 2020 investor confidence index as an example. After the outbreak, the index dropped noticeably, largely because people had safety and survival concerns facing the pandemic and its unknowns. As the pandemic gradually came under control, the confidence index gradually recovered. By March and April, survival and safety were basically secured, and people began focusing more on feelings, leading to another dip in confidence. It wasn't until April, when the new normal set in, that the confidence index began rising again.
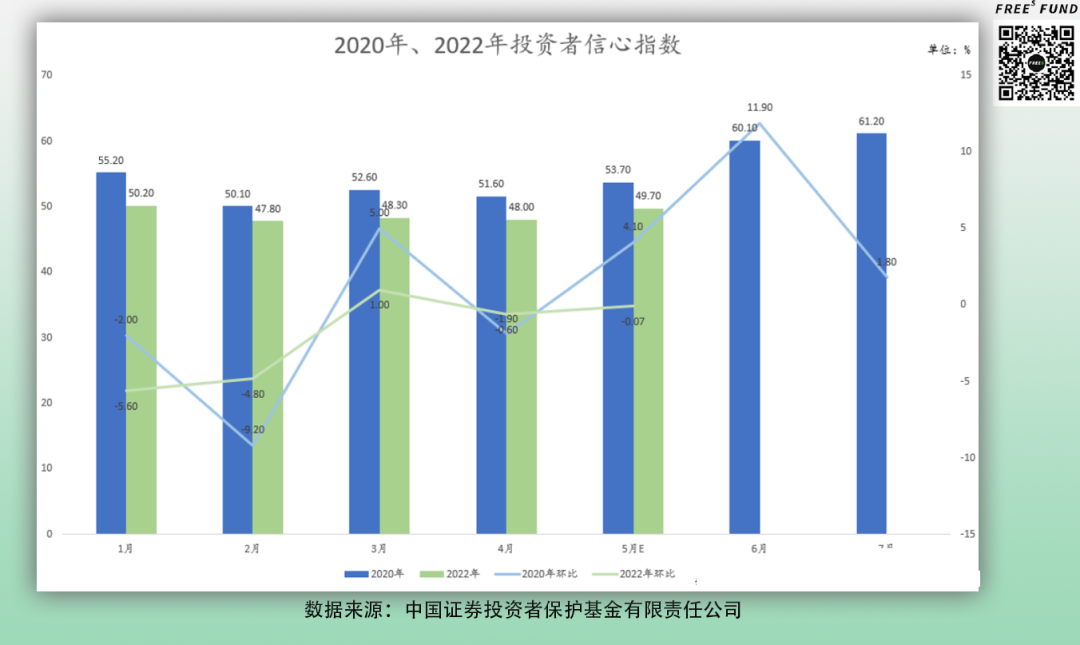
Looking at 2022 (the green line), we see that compared to the dramatic swings of 2020, the confidence index followed a relatively flat trajectory. This likely reflects the fact that after two years of experience, people had developed more grounded expectations about how the pandemic might unfold. However, we can also see that investor confidence in 2022 lacked the rebound elasticity of 2020 — mainly because when outbreaks recurred in 2022, the emotional toll felt more immediate than concerns about survival or safety.
So what about economic performance in the second half of 2022?
If America's current strategic priority is slowing the pace of bubble deflation to engineer a soft landing, our strategy — based on publicly available information — appears to be securing the economic base first, then stimulating elastic growth.
In early April, an economic symposium with experts and entrepreneurs emphasized the need to stabilize the economic foundation and keep performance within a reasonable range, calling to "maintain confidence while confronting difficulties." On May 23, the State Council executive meeting approved 33 measures across six areas to stabilize the economic base. On May 25, the State Council convened a "national teleconference on stabilizing the economic大盘." On June 15, another executive meeting rolled out measures to support private investment and advance multi-benefit projects, expanding effective investment while boosting consumption and employment.
What constitutes the "economic base"? Consider the three charts below.
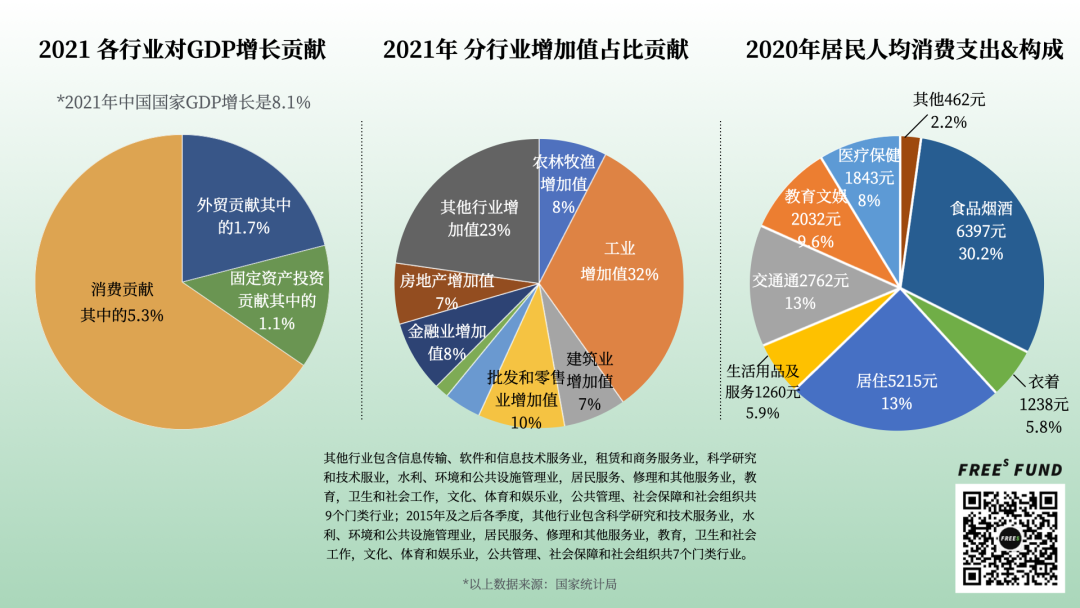
Start with the leftmost chart. In 2021, China's GDP grew 8.1%, driven primarily by three engines: consumption, foreign trade, and fixed-asset investment.
Viewed from the industry value-added perspective — the middle chart — China's total GDP exceeded 114 trillion yuan in 2021. The "economic base" corresponds to sectors with larger shares here: industry, real estate and construction, wholesale and retail, finance, and so on.
As noted earlier, we've been unable to rapidly stimulate growth through real estate since 2016. Our quick "growth pull" has come mainly from the yellow segment in the left chart — consumption — which is more elastic. The pandemic's impact on consumption has been substantial over the past two years. If consumption can be effectively stimulated, the resulting growth elasticity could be significant, even exceeding expectations. The rightmost chart breaks down household consumption expenditure by sector.
However, given current conditions and the unexpected challenges that have emerged, protecting economic performance may require returning to industries with larger GDP value-added contributions — safeguarding the floor of base growth — before addressing how to enhance growth elasticity and room for expansion.
**One small favorable condition for fourth-quarter growth acceleration: the low base from Q4 last year.
Additionally, we expect this year's primary market to resemble 2020, with a wave of activity in Q4. First, participants need time to adapt to the chain effects of COVID-19 as the new normal. Second, the government's substantial stimulus measures in Q2 typically require one to 1.5 quarters to implement and take effect. Thus, positive developments may emerge starting in Q4.
In summary, both Chinese and American capital markets face near-term challenges. But America's test stems from accumulated bubbles across multiple financial cycles, while China's lies in protecting the economic base amid COVID-19, international relations, and other factors, then accelerating elastic growth as quickly as possible. Relatively speaking, America's challenge is greater; ours is shorter-term.**
**---
Long-Term Factors
Next, we'll examine the long-term prospects of Chinese and American capital markets through the lens of market capitalization-to-GDP ratios.
An Overvalued US Market
The basic logic: the higher the market-cap-to-GDP ratio, the faster the stock market is running relative to economic growth. We typically use this metric to assess whether equities have become inflated.
The US market-cap-to-GDP trajectory has several notable inflection points. During the 2000 dot-com bubble, US market capitalization reached roughly 1.5x GDP. More recently, the Fed's global liquidity flood to combat COVID-19 inflated asset price bubbles worldwide, adding approximately $50 trillion in global debt, and pushed US market capitalization to nearly 2x GDP.
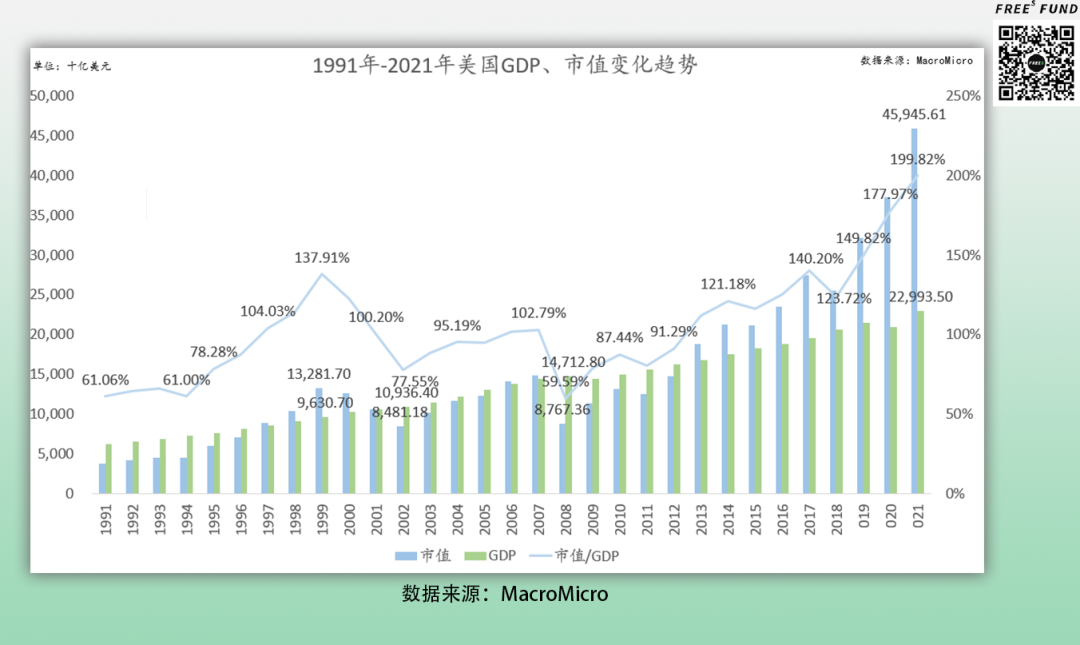
What did last year's US market-cap-to-GDP performance indicate? Using Warren Buffett's benchmark — where a country's capital market size at 80% to 120% of GDP represents a reasonable range — US market capitalization began deviating from this interval throughout 2021 or from late 2020. This suggests US equities may be seriously overvalued, with substantial bubbles.
While aggressive US fiscal and monetary policy post-outbreak did stimulate growth, and the gradual containment of COVID-19 warmed consumption, the overall economy remains noticeably below pre-pandemic levels. And as the impetus from policy stimulus and reopening fades, US economic growth may face fresh headwinds.
China's Capital Market Enters the Economic Mainstream
Turning to China. As GDP has grown, the market capitalization of Chinese capital markets has steadily increased as a share of the economy.
At end-2014, total A-share market capitalization stood at 37 trillion yuan. By end-2015, it reached 52.96 trillion yuan. After roughly seven years of development, A-share market capitalization first broke 90 trillion yuan at end-2021. As of the May 20, 2022 close, total A-share market capitalization was approximately 83.44 trillion yuan.
Viewed along this longer timeline, even at the peak of pre-"stock market crash" froth in 2015, market capitalization was still below 60% of GDP. This year, despite numerous challenges, China's total capital market remains at roughly 80% of GDP.
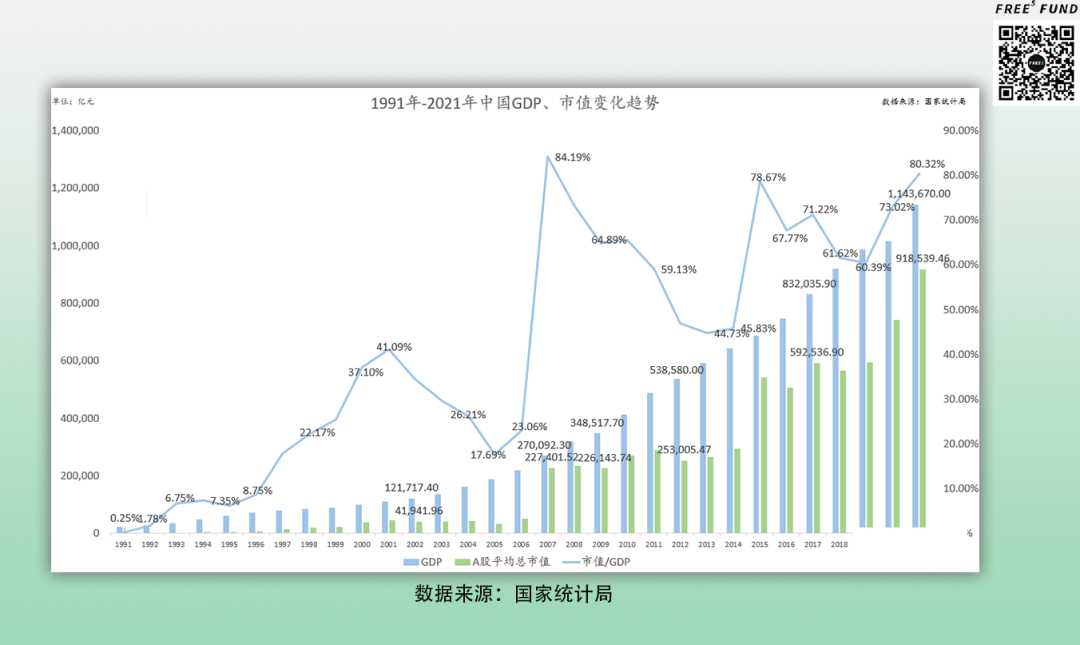
The shift from below 60% pre-2015 to over 80% in 2021 illustrates two developments:
First, over seven years, China's direct financing market — as represented by capital markets — has gradually expanded to approach the scale of GDP. Referencing Buffett's benchmark, China's market-cap-to-GDP ratio remains within reasonable bounds.
Second, the status of China's capital markets has fundamentally changed. Seven years ago, capital markets were merely a supplementary tool for economic development and adjustment. Today, China's capital markets (and primary/secondary market financial instruments) have ascended to become mainstream financial instruments for economic development.
Looking ahead, as China's economic growth returns to normal levels, capital market scale will inevitably rise with it. The question becomes: where will the new money come from?
One reference point is total social financing — the money released into markets annually.
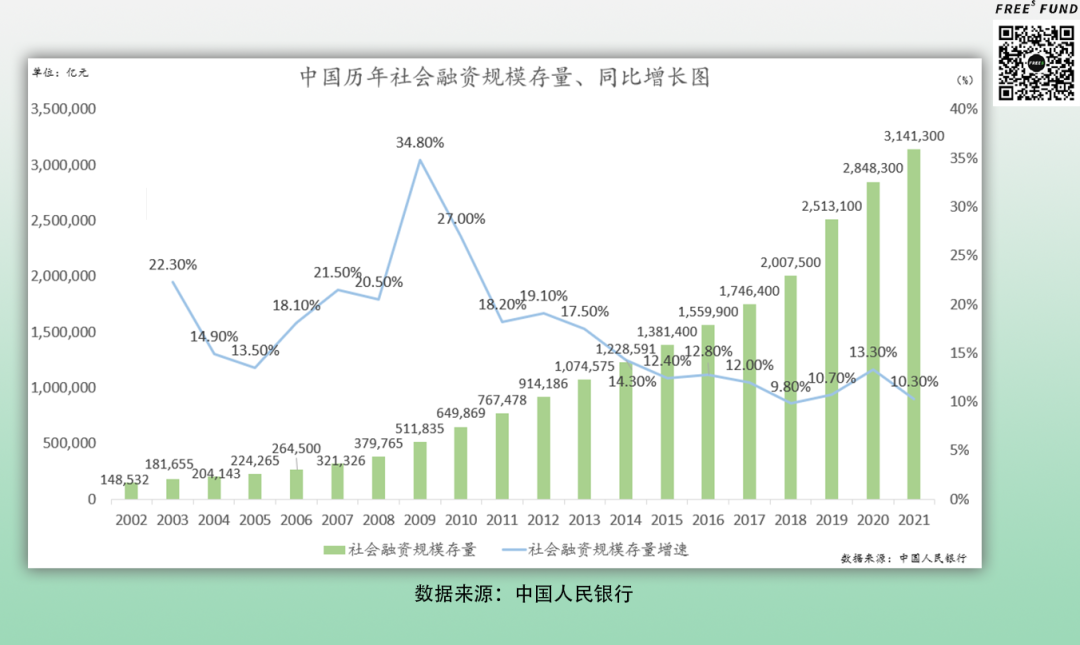
Total social financing divides into direct and indirect financing. Indirect financing primarily refers to bank lending. Direct financing includes equity financing (capital markets) plus corporate bonds. Currently, direct financing — particularly equity financing — remains a relatively small share of the overall financial system. Data shows that as of end-September 2020, China's direct financing stock reached 79.8 trillion yuan, approximately 29% of total social financing stock. During the 13th Five-Year Plan period, new direct financing totaled 38.9 trillion yuan, accounting for 32% of incremental social financing.
Comparing with the US market: America is a global financial center with highly developed financial services and derivatives markets. According to Sina Finance, in 2020 US direct financing accounted for nearly 80% of total financing. Going forward, it will be difficult to drive growth through massive social financing expansion — especially with market-cap-to-GDP far exceeding the Buffett indicator.
Expanding direct financing is the future direction for China's capital markets. As clearly stated in the 14th Five-Year Plan and 2035 Long-Range Objectives outline: improve capital market foundational institutions, develop multi-tiered capital market systems, expand institutional investors, and increase the proportion of direct financing, especially equity financing. Over an extended time horizon, China's capital market scale will grow larger, as will direct financing.
In the long run, changes in financing scale and the rising share of direct financing may produce several effects:
-
Benefits for the establishment and development of private equity investment funds. Looking ahead, fund exit mechanisms will become more diverse, sound, and secure.
-
Greater emphasis on multi-tiered capital market structures, better satisfying financing needs of enterprises at different development stages.
-
Higher financial asset composition within household wealth, with monetary and fiscal policy stimulus transmitting more rapidly to the economy.
In summary, the chain effects triggered by financing scale changes will have profound and lasting impacts on industries and markets.
Therefore, whether viewed from short-term or medium-to-long-term perspectives, from money supply or money's role, China compared to the US is currently experiencing less a "capital winter" than a late spring cold snap. Despite some constraints, FreeS Fund's investment pace and volume haven't been substantially affected.
So there's no need for excessive concern. 2022 overall hasn't been worse than the same period in 2020, macro indicators show relatively better recovery elasticity, and stimulus policy intensity remains undiminished. We believe the warmth after this cold snap will soon be visible. We're inclined to believe that those willing to persist in entrepreneurship amid the chill or challenges typically possess correct original intentions, sufficient capabilities, and remarkable resilience.
Finally, looking at current capital market data, China, the US, and Europe each have their own troubles to deal with. China must seek steady progress while managing both internal and external challenges. The US needs to avoid a bubble burst and engineer a soft landing for its economy. Europe faces the fallout from war and inflation. In the coming year, whichever country achieves relatively stronger growth by comparable metrics may win global capital favor sooner.
Summary
Core Argument
When we compare the short-, medium-, and long-term factors affecting both countries' capital markets, the US appears to be in late autumn heading into winter, while China looks more like it's experiencing a cold snap in spring.
Short-Term Factors
Both China and the US are currently facing tests in their capital markets, but America's challenges stem from accumulated bubbles across several historical financial cycles — the adjustment and recovery could take considerably longer. China's test is to protect its economic foundation amid phase-specific pressures from COVID-19 and international relations, while quickly stimulating elastic growth. This reads more as a phase-specific adjustment and challenge.
Medium-Term Factors
When the US financial system takes a hit, it creates significant volatility for households and societal wealth. By contrast, Chinese household assets are relatively insulated from financial system fluctuations, and China's sources of social wealth and supply have not suffered severe damage at present. The reasons behind the current market declines differ between the two countries. The US is driven primarily by liquidity factors, while China's market decline centers on policy, COVID-19, and localized conflicts. Consequently, market performance and corresponding adjustment strategies diverge.
Long-Term Factors
The US capital market has an extremely high proportion of direct financing, with the stock market severely overvalued and potentially carrying substantial bubbles — making it difficult to drive economic growth through further direct financing expansion. China's capital market has considerable room to grow by increasing its direct financing ratio.
Engagement
From your perspective, did China and US capital markets face a winter in 2022? Share your thoughts in the comments. The 6 most thoughtful commenters will receive a FreeS Fund custom edition of 2030: How Today's Biggest Trends Will Collide and Reshape the Future of Everything. We look forward to finding certainty amid change and staying sharp together.

▲ What happens when the hottest tech tracks intersect? | FreeS Chip Series
▲ Bidding Farewell to a Year of Transition — Will 2022 Be Better? | Li Feng's New Year Outlook
▲ Expansion or Store Closures? Re-examining Offline Opportunities | Li Feng Column
▲ Breaking Consumer Industry Involution — Is the Secret "Going Premium"? | Li Feng Column