Learning About Early-Stage Investing From the Secondary Market: Where Are the Opportunities and Timing for Consumer Startups?

Capital markets are a microcosm of the broader economy.

In the primary market, one frequently discussed question is: what is the best timing to start a company? Even when we can recognize certain industry development patterns, it is difficult to pinpoint the exact moment. In today's research, we try a new approach: using secondary market indicators to make predictions, hoping to identify opportunities and timing points for entrepreneurship and investment.
We use two indicators in this study: ① Industry share of GDP (reflecting actual industrial scale): industry output ÷ GDP; ② Industry market cap share of A-shares (reflecting capitalization level): total market cap of A-share listed companies in the industry ÷ total A-share market cap;
Before analyzing individual industries in detail, we make the following assumptions:
- Industry market cap share of A-shares < industry share of GDP means the industry is not fully capitalized.
- Industry market cap share of A-shares ≥ industry share of GDP means the industry has a high degree of capitalization. This industry may have already experienced sufficient market competition, and leading companies in some industries may have significant valuation premiums.
The capital market is a microcosm of the macro economy. The proportion of listed companies' market cap in an industry relative to total market cap reflects that industry's capitalization level; its industry's total output as a share of GDP reflects the industry's actual scale and operating conditions. Ideally, an industry's capitalization level and its industrial scale as a share of GDP should converge. But in reality, due to insufficient market concentration and other reasons, some industries' capitalization rates fail to fully reflect their actual industrial scale.
From an investment perspective, when an industry's capitalization rate is lower than its actual industrial scale, it means there is room for that capitalization rate to increase. In other words, in this industry, there is upside potential for both the market cap and the number of listed companies.
In this article, we take the consumer sector as an example, comparing the capitalization levels of different sub-industries with their actual industrial scales, to study two core questions:
- Which consumer sub-industries have relatively insufficient capitalization rates?
- How do capitalization rates of consumer sub-industries change over time? What factors may influence this? What implications does this have for the timing of consumer entrepreneurship?
Before diving into the main text, here are our preliminary conclusions:
By comparing the differences between consumer sub-industries' shares of GDP and their capitalization rates, we found:
- In the consumer sector, industries with high product standardization and relatively concentrated markets, such as baijiu (Chinese liquor), food processing and meat, also have high capitalization levels. Meanwhile, industries like apparel, furniture and home decoration, soft drinks, daily chemicals, and tourism account for considerable shares of GDP, yet their industry capitalization rates are noticeably insufficient.
Through analysis of industry market cap trend changes, we reached two additional conclusions:
- Overall industry market cap increases are usually accompanied by factors such as product price increases, raw material cost declines, and shifts in market demand. The driving effects of these factors have a lag and are not always immediately reflected in the secondary market. The time gap between "when driving factors emerge" and "when they are reflected in the secondary market" is precisely the investment timing window that people seek for secondary market investing.
- Furthermore, after an industry's market cap share of A-shares rises, as market sentiment cools, the industry's market cap share of A-shares will experience a certain degree of pullback. During this pullback, opportunities for new brands or new categories typically emerge — and we may be able to identify suitable timing points for consumer entrepreneurship from this.
Below is the detailed analysis, which we hope provides some inspiration. The author Zinan Chen welcomes discussion (chenzinan@freesvc.com). FreeS Fund continues to pay attention to investment opportunities in the consumer sector; business plans are welcome at bp@freesvc.com, and you may also contact Feng Xiaorui on WeChat (ID: freesfund).

Consumer Sector Industries: Share of GDP vs. Share of A-Shares By Zinan Chen (chenzinan@freesvc.com)
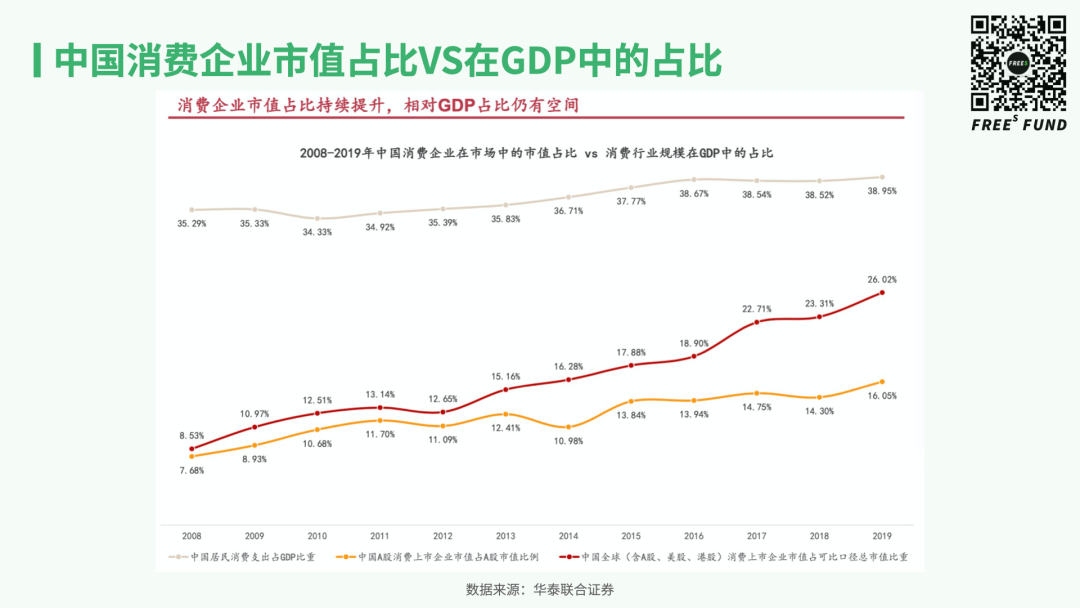
In recent years, both the global market cap share of Chinese consumer companies and the proportion of A-share consumer listed companies in total A-share market cap have risen rapidly. According to Huatai United Securities' statistics, in 2019 these two figures reached 26.02% and 16.05% respectively.
However, the consumer industry's capitalization rate has not fully reflected its actual scale. China's consumer industry accounted for 38% of GDP (2019 data). Compared to 26.02%, 16.05%, and 38%, there remains a significant gap.
We break down the consumer industry, comparing the GDP share of certain consumer sub-industries with their market cap share of A-shares, to see which sub-industries have insufficient capitalization and whether investment opportunities may exist within them.
Market cap data for companies and industries in this article is drawn from 2019 average market cap data for A-share industries. GDP data is taken from 2019 statistics bureau releases.
I. What Do Capitalization Rates Look Like Across Different Consumer Sub-Industries?
01 Industries Where Market Cap Share of A-Shares > Share of GDP
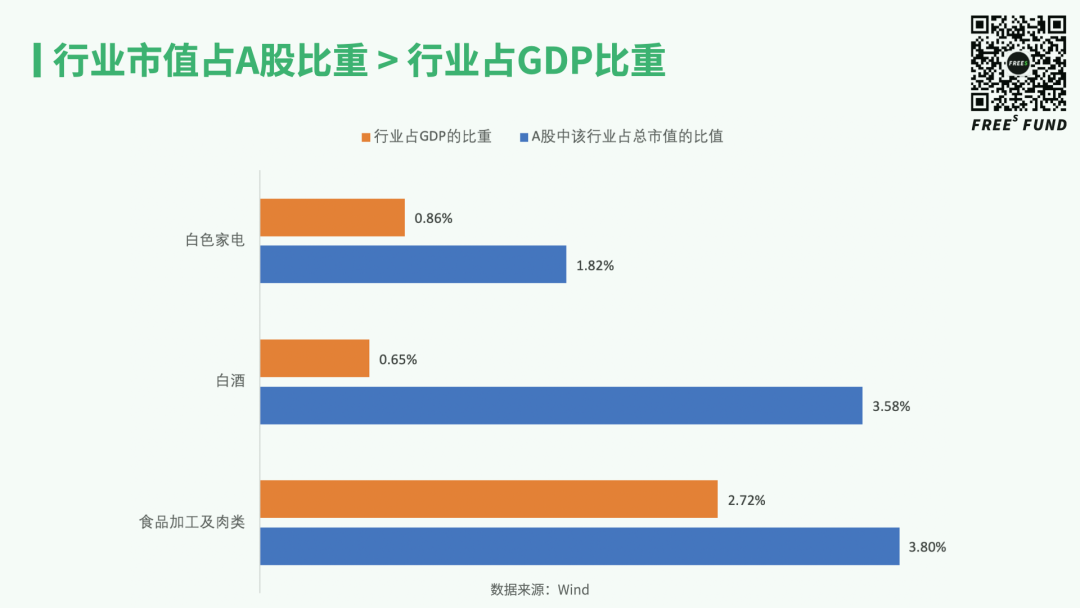
Industries where market cap share of A-shares exceeds share of GDP include baijiu, food processing and meat, and white appliances.
By sorting, consolidating, and calculating the market cap shares of consumer sub-industries in A-shares, we found: the baijiu industry's market cap share of A-shares reached 3.58%, while its share of GDP was only 0.65%. Food processing and meat reached 3.80% of A-share market cap, but only 2.72% of GDP. White appliances reached 1.82% of A-share market cap, but only 0.86% of GDP.
A common characteristic of these industries is high product standardization. After long-cycle competition, large companies have consolidated industry supply chains, small companies have been eliminated, and capital in the market has flooded into leading enterprises. At this point, leading companies exhibit valuation premiums — that is, their market cap share exceeds their industrial scale's share of GDP.
For now, the likelihood of structural change in these consumer sub-industries appears small. But going forward, factors such as shifts in consumer behavior, technological innovation, or the rise of new categories may disrupt traditional industry structures.
02 Industries Where Market Cap Share of A-Shares < Share of GDP
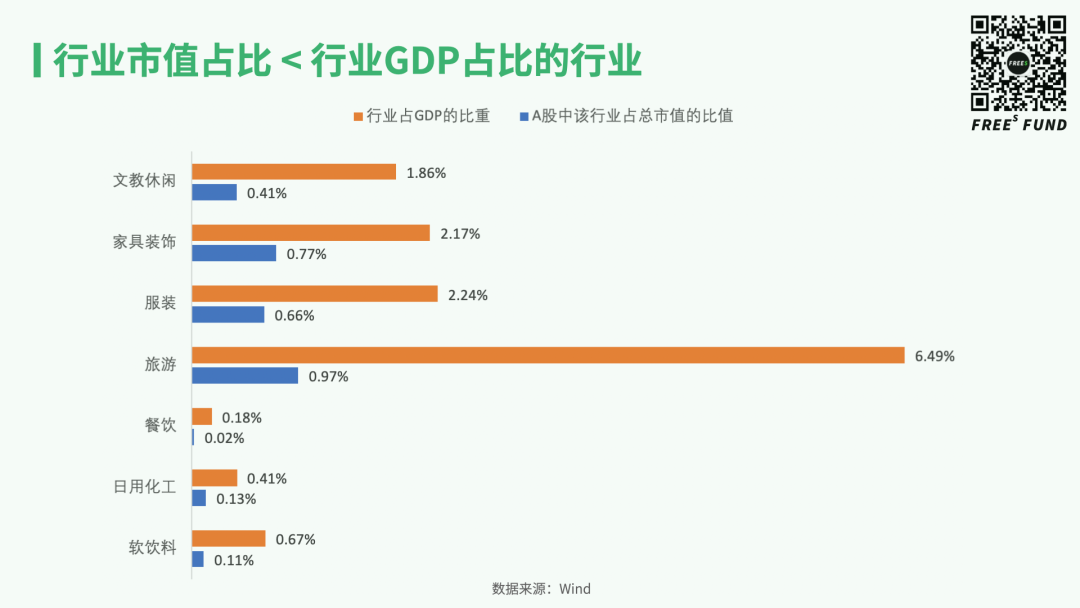
Soft drinks, apparel, tourism, dining, daily chemicals, and other industries shown in the chart above all have considerable industrial scale and occupy certain proportions of GDP. However, the data shows that these industries' market caps in the capital market may not yet fully reflect their actual scale.
The gap between industry market cap share and industry GDP share is mainly caused by the following factors:
First, in sub-segments such as soft drinks and daily chemicals, overseas brands hold considerable market share in China, but foreign companies cannot list on A-shares. These industries present opportunities for domestic brands to replace overseas brands.
Second, industries such as tourism, apparel, and furniture and home decoration have low product standardization (difficult to replicate at scale), strong regional characteristics, and insufficient market concentration. These industries may undergo consolidation in the future, allowing their market cap share of A-shares to approach their share of GDP.
Third, due to policy constraints and other factors, industries such as education and retail platforms currently face difficulties achieving high capitalization. Going forward, as the A-share registration-based IPO system is gradually implemented, the actual industrial scale of this category of industries may have opportunities to be further reflected in the capital market.
Soft Drinks, Daily Chemicals, and Similar Industries: Opportunities for Domestic Brands to Replace Overseas Brands
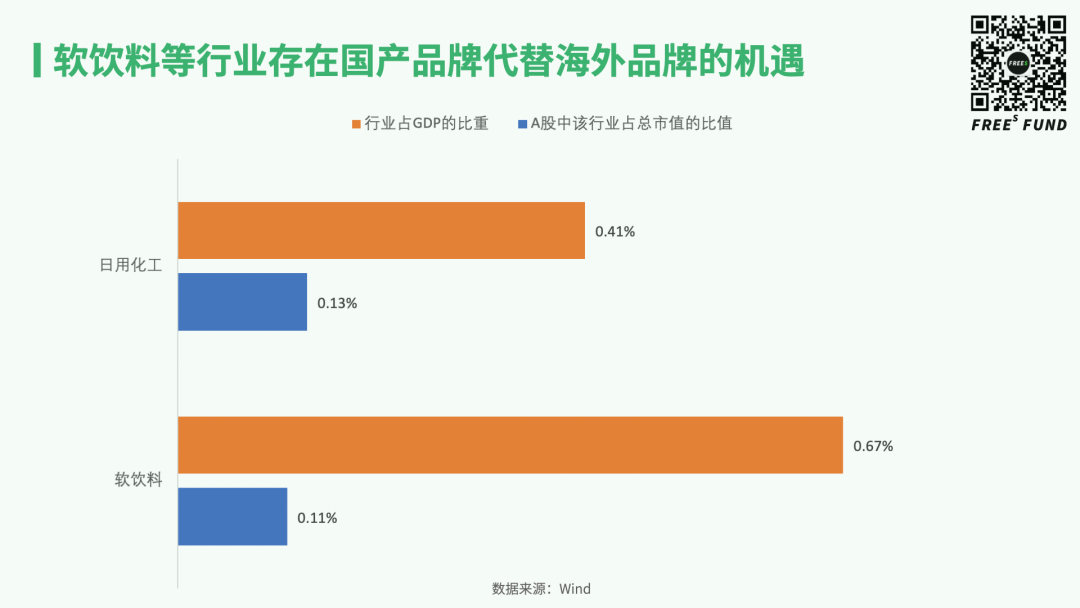
Soft drinks: The soft drink industry's scale as a share of GDP reached 0.67%, yet the total market cap of listed companies in this industry as a share of A-shares was only 0.11%.
Due to the early opening of the soft drink industry to foreign investment, for a considerable period after 2000, when people thought of soft drinks, Coca-Cola, Sprite, and other carbonated beverages came to mind first. Nielsen market research reported that in 2002, Coca-Cola's series of beverages held over 50% market share in China. By 2017, Coca-Cola's China market share had dropped to 17%.
In recent years, as e-commerce channel penetration in China has continuously increased and new marketing and sales methods such as livestreaming and short video have emerged, competition in the soft drink market has intensified and the industry has seen new changes. In 2020, although Coca-Cola still ranked first in China market share, it was only about 1 percentage point higher than second- and third-place Master Kong and Nongfu Spring.
Industry concentration went from high to low, overseas brands' share has continuously declined, and the industry may undergo further consolidation going forward — presenting opportunities for domestic brands to further replace overseas brands.
Daily chemicals (including cosmetics): The daily chemical industry's scale as a share of GDP reached 0.41%, yet the total market cap of listed companies in this industry as a share of A-shares was only 0.13%. This means the daily chemical industry has a low capitalization rate.
One possible reason is that overseas brands such as Procter & Gamble and L'Oréal currently occupy portions of the domestic daily chemical market. Qianzhan.com notes that among the top ten daily chemical product brands in the Chinese market, only three are Chinese domestic enterprises. The result is that the daily chemical industry's market cap share of A-shares is lower than its share in the industrial structure — that is, the domestic capital market has not yet been able to fully reflect the overall scale of the domestic daily chemical market.
Similar to soft drinks, the daily chemical industry also has room for domestic brands to replace foreign brands. In this space, FreeS Fund has invested in hair care brand Zhi Guan, skincare brand Innoxa, and makeup brand JUNO.
Industry consolidation will further lift the capitalization of travel, dining, furniture and home renovation, and apparel
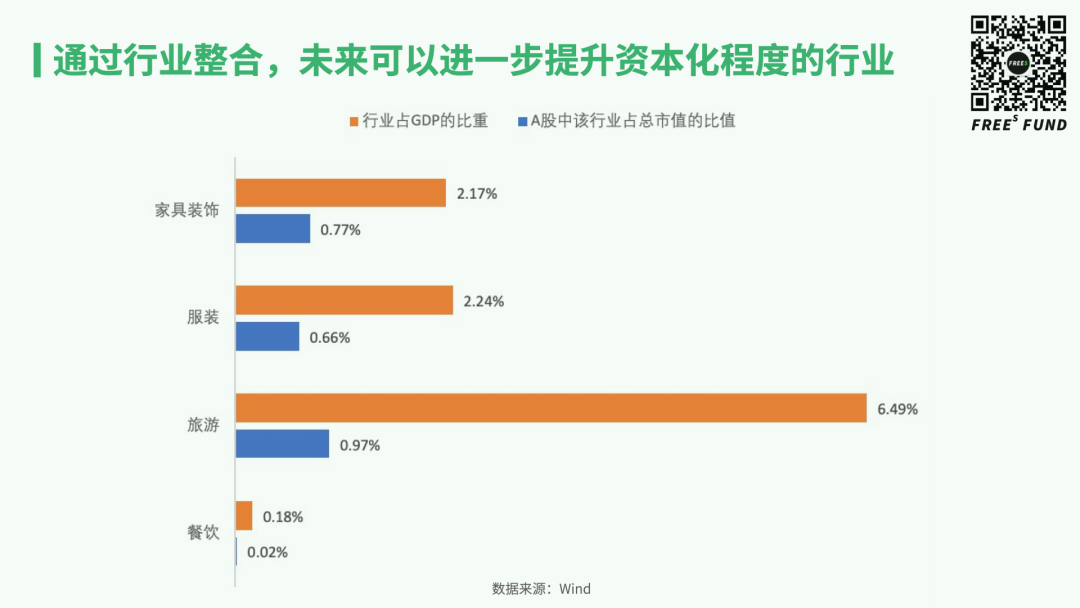
Travel, dining, furniture and home renovation, and apparel together account for roughly 11% of GDP. But because their products are difficult to standardize and their markets remain highly fragmented, these industries carry relatively low capitalization rates. Combined, they make up only 2.42% of total A-share market cap. Going forward, as standardization and market concentration improve in travel, dining, and furniture and home renovation, their degree of capitalization could rise substantially.
Take travel first. The industry represents a hefty 6.49% of GDP, yet it has never produced anything resembling a BAT-level internet giant, and its capitalization rate sits below 1%. For comparison: Alibaba commands a $600 billion market cap on US exchanges, while leading online travel service Trip.com Group trades at less than $200 billion (based on prices at the time of writing).
Travel breaks down into two segments: scenic destinations and travel services.
Scenic destinations are resource-dependent and inherently impossible to replicate at scale. You can't build another Huangshan in Beijing, and consumers visit infrequently — making it hard for these assets to shine in public markets.
Travel services, by contrast, represent a massive market. But the value chain is long, spanning dining, hospitality, and other sectors, leaving the industry fragmented and dominated by small players. The pandemic in 2020 forced a shakeout that eliminated many of these micro-enterprises.
Relative to scenic destinations, travel services operate on more replicable business models. This creates room for consolidation and restructuring, and therefore significant upside for the segment's share of A-share market cap. In this space, FreeS Fund has invested in Qingke Travel, a light-asset travel services brand.
Turning to apparel: the industry accounts for 2.24% of GDP but only 0.66% of A-share market cap. Concentration here is also low. According to Qianzhan Industry Research Institute, in 2018 the top 10 companies in China's apparel market held less than 10% combined share. Adidas and Nike tied for first at 1.9% each, while domestic brand HLA ranked second at 1.1%.
Apparel's low concentration may reflect the fact that Chinese clothing consumption is still largely about meeting basic needs — brand may not yet be the top priority for consumers. But as consumption upgrades continue, distinct consumer circles are forming. Categories that serve specific segments — suits, jackets, dress shirts, women's lingerie, children's clothing — may be the first to develop strong brands. This would help leading players in these niches gain share and drive broader consolidation in apparel. These shifts will eventually be reflected in capital markets.
For entrepreneurs, a viable path may be to enter through a single category, lock in a specific consumer group, and gradually deepen brand recognition.
Furniture and home renovation similarly show capitalization rates well below their GDP weight. The sector makes up 2.17% of GDP but only 0.77% of A-share market cap.
The industry is large but lacks strong leaders. Brand maturity remains low, logistics costs are high, and installation services are required. Distribution channels are highly fragmented, with local showrooms, local brands, and local developers forming insular ecosystems that prevent share from concentrating at the top.
In recent years, as the share of real estate developments delivered with finished interiors has grown, bulk business has become the main growth driver for furniture and home renovation.
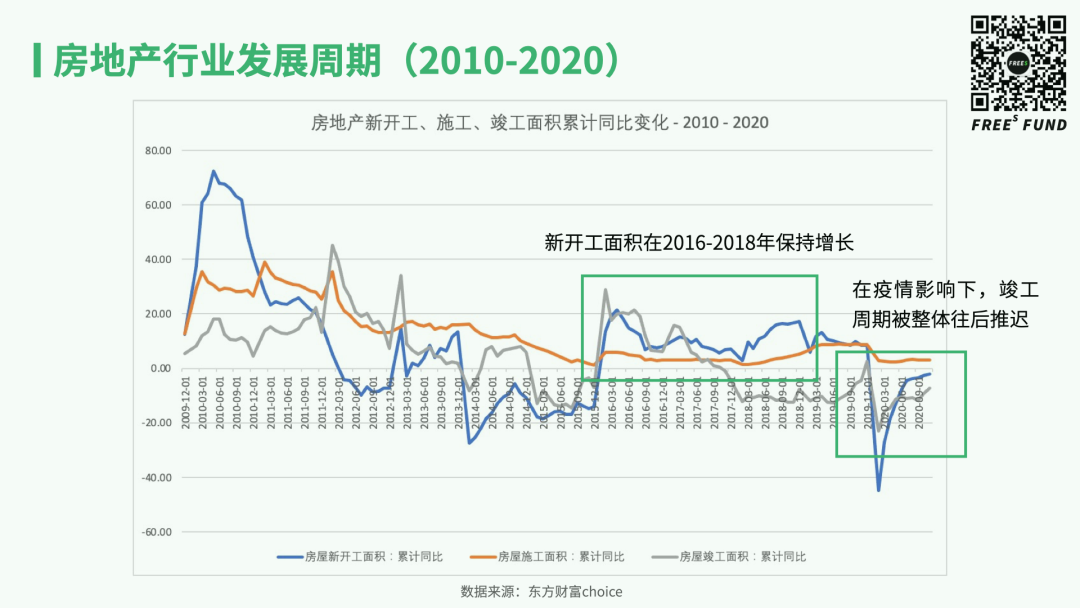
National Bureau of Statistics data shows rapid growth in real estate development area between 2016 and 2018. Given a typical 2–3 year development cycle, 2019–2020 should have been the completion peak for these projects. The pandemic pushed this cycle back. In the second half of 2020, as domestic COVID conditions eased, decorative materials — the first link in the "renovation-furniture-appliances" chain — was the first segment to recover. Going forward, we believe consolidation in home renovation and furniture will accelerate, and these industry changes will eventually be reflected in capital markets.
A-share registration reform opens more paths to capitalization for education, culture, and leisure
Education, culture, and leisure account for 1.86% of GDP but only 0.41% of A-share market cap.
Take education specifically. For a long time, policy restrictions made it difficult for education companies to list on A-shares, forcing most to go overseas. With the rollout of registration-based IPO reform, education's A-share capitalization rate may gradually improve. On January 12, 2021, the first independent education and training company debuted on A-shares through IPO, opening new possibilities for the sector's capitalization. In education, FreeS Fund has invested in innovative companies including Onion Academy, Qingqing Education, Deer Music, Shanbay, Juvenile Dedao, and Momself.
What drives capitalization rate improvement?
Having compared capitalization rates with GDP shares across consumer sub-sectors, let's examine: when do these market-cap-to-A-share ratios rise, what drives them, and where might investment opportunities lie?
Reviewing key events during periods of rising capitalization across consumer industries, we find a cyclical pattern: structural shifts caused by product price increases, raw material cost declines, or demand changes → rising enterprise value and profits → increased sector weight in A-share market cap.
These drivers don't always immediately register in secondary markets. This lag creates a time window that typically signals investment opportunity.
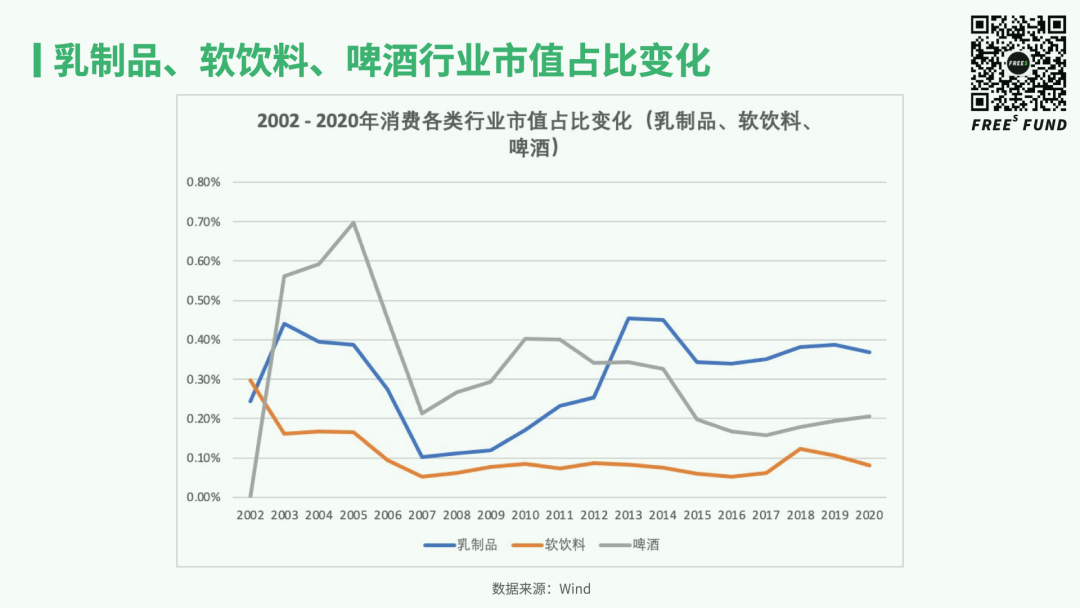
In 2008, the melamine scandal triggered supply-side structural reform in dairy. Product quality improved, fresh milk prices rose, and profit margins expanded. Starting in 2011, dairy's share of A-share market cap climbed sharply, peaking in 2013 before stabilizing.
Product price effects on market performance also appeared in beer. In 2008–2009, barley prices rose across the board, prompting industry-wide price increases. Higher per-ton prices brought greater profit margins and concentrated share among leading players. By 2010, beer's A-share weight hit its peak.
Since 2010, market structure has shifted in daily chemicals too. Washing and oral care products lost share in sales terms, while higher-ASP categories — skincare, color cosmetics, and fragrance — gained ground. The number of color cosmetics companies grew. These structural changes lifted the industry's market cap in subsequent years, peaking in 2013.
In education and culture, policy barriers to listing tutoring companies on A-shares meant listed players were mainly toy, piano, and stationery makers. The two-child policy launched in 2011 and further loosened in 2013 expanded the education market's potential. In 2015, the sector's A-share weight reached 0.42%, a new cyclical high.
In travel services, starting in 2015, leading OTAs transformed from standalone flight or hotel booking to bundled "flight + hotel" or "flight + hotel + ticket" packages, driving overall industry growth. Travel services' market share rose from 0.26% (2015) to 0.32% (2019).
Even in 2020, when travel was devastated by COVID, travel services' market share continued climbing — suggesting strong market confidence in the sector's recovery. The pandemic may prove to be an opportunity for restructuring and consolidation in travel.
Implications for consumer goods entrepreneurship
After examining what drives rising sector weights in A-shares, we observe that once this ratio peaks, market sentiment gradually cools and the weight undergoes some correction.
This correction period typically creates openings for new brands or new categories. This is especially pronounced in consumer goods and offers a useful reference for identifying emerging brands.
Historically, in consumer sub-sectors, when an industry's market-cap share reaches its peak, that is usually the optimal moment to launch new brands and models; the subsequent correction phase becomes the best window for these new brands to capture share.
This pattern is visible everywhere in everyday consumer scenarios. Here are five examples.
After dairy's capitalization rate peaked in 2013 and began correcting, new brands emerged in yogurt and probiotic beverages, expanding their market share in subsequent years.
We observe a similar pattern in liquor.

From 2012 to 2013, liquor's A-share weight surged. In 2012, it reached its first peak since 2000 — the same year that budget liquor brand Jiangxiaobai was founded. During liquor's market-cap correction, Jiangxiaobai expanded its share and gradually became a household name. One likely reason: leading liquor companies focused on mid-to-high-end products, neglecting demand at the budget end.
The same dynamic played out in beer. From 2011 to 2016, beer's A-share weight corrected. A China Merchants Securities research report shows that during this same period, craft beer and light-flavor beer consumption grew rapidly, maintaining rates above 40%.
In 2012, the soft-drink sector's market-cap share hit a new peak before a modest correction. From 2013 to 2014, the market saw a wave of new near-water beverages such as Hai Zhi Yan and Shuirong C100. In 2018, soft drinks' market-cap share rose again; during the subsequent pullback, new categories like soda water emerged, with Genki Forest as the standout example.
A similar pattern unfolded in personal and home care. The sector's market-cap share peaked in 2010, and during the correction that followed, global giants such as Procter & Gamble and Unilever lost ground while domestic brands grew rapidly. In 2017, color cosmetics gained share within the broader personal-care market, lifting the entire sector's market-cap weight over the next two years. This period saw the rise of domestic color-cosmetics brands including Perfect Diary.
Key Takeaways
To summarize, after examining the capitalization rates and GDP shares of consumer sub-sectors, we have identified several potential investment and entrepreneurship opportunities:
- In soft drinks and personal/home care, domestic brands have room to replace foreign incumbents;
- In traditional industries such as travel, dining, furniture and home renovation, and apparel, low product standardization and market fragmentation prevail. Going forward, these sectors may see consolidation and moves toward greater standardization — shifts that will ultimately be reflected in capital markets;
- Education, once constrained by policy, was unable to translate its true scale into market capitalization in the near term. With the rollout of A-share registration-based IPOs, these industries now have substantial room for imagination.
Moreover, looking back at nearly two decades of consumer-sector development, we find that different sub-sectors have passed through remarkably similar cycles: variables such as product-price increases, raw-material cost declines, and shifts in market demand emerge → corporate value and profits rise → the sector's A-share market-cap share expands → market sentiment cools and valuations correct → new brands are born and grow.
Put simply, most consumer sub-sectors have gone through a process of valuation expansion. And during the secondary-market valuation corrections, the primary market has also produced innovations in brands and categories.
We hope this offers a fresh perspective. We welcome your thoughts in the comments.

▲ Where Is Live Commerce Headed? Lessons from TV Shopping History for New-Brand Entrepreneurs | FreeS Research
▲ Where Does E-commerce Livestreaming End? | FreeS Research
Li Feng Column 15 | How Long Will Live Commerce Stay Hot?
What Makes the Low-ABV Markets of China, the US, and Japan So Different? | FreeS Research
FreeS Report 19 | The Tipsy Era: Where Are the Opportunities in Low-ABV Entrepreneurship?
The Secret Behind Instant Food's Explosive Popularity in 4 Minutes | FreeS Daily Business Thoughts
Galaxies in Your Eyes: One Chart Explaining the Rise of Colored Contact Lenses | FreeS Research