A Small Bit of Experience from the Manus Team on Evaluating Models

Feeling studious today.
"Today I Learned"
Two days ago, I came across a post on Jike by @Hoodie Hu about how to measure whether an agent's research report is readable. The metric he chose was metaphor rate — measuring how frequently the model uses metaphors.
For instance, Claude Fable-5 is incredibly intelligent, but I have to read its output twice. A big reason is that it fires off analogies like a machine gun, never speaking plain human language.
After chatting with Hoodie Hu, I learned he works on evaluation at the Manus team. A major part of his work is Research Bench — evaluating the quality of research outputs produced by models within Manus. The metaphor rate metric emerged from building Research Bench.
As we all know, most work scenarios are harder to build verifiable standards for than coding scenarios.
Hoodie Hu's approach is to find signals that reflect users' key experiences within complex, hard-to-verify work, then use them to objectively evaluate model-generated results.
I found his approach inspiring, so I invited him to expand on his original Jike post. Here's the refined version:
As LLM coding capabilities mature, their text generation abilities seem to be regressing — the writing is getting wilder and harder to read.
In Manus, deep research report writing is a fundamental user scenario. Building effective metrics to measure report quality and provide meaningful feedback for harness iteration became urgent.
At its core, a research report's quality involves only two dimensions:
First, what information does the report contain? This determines whether users get the high-quality information they want.
Second, how is this information organized? This determines whether users can understand what they read with low effort.
From these two dimensions, many metrics can be constructed. Today, I'll introduce two metrics Manus practices: "Information Density" and "Metaphor Rate."
Both metrics share two principles in their construction:
First, effectiveness — the signal should directly and concisely reflect a specific model characteristic, with scores high or low helping us trace back and fix product issues.
Second, reliability — all metrics should be as quantifiable as possible, enabling stable results even at large-scale automated evaluation.
01
Information Density
In 2025, many AI research products have been "optimized" to resemble OpenAI's DeepResearch — writing long enough to give users a sense of substantial value.
"Writing long" is a deeply misleading optimization target. Users' fundamental need when using agents for research and reports is efficiently obtaining sufficient relevant information.
A report full of valid information isn't necessarily longer than one full of fluff, and the latter severely damages user experience.
Thus, we built the "Information Density" metric, using an LLM to extract the number of factual/data points in a report.
For example, on the same topic, Model A's report states:
"In 2001, Apple released the iPod, using Toshiba's 1.8-inch micro hard drive with 5GB capacity, paired with the Click Wheel and FireWire high-speed interface, redefining portable music players with '1,000 songs in your pocket.' In 2003, the iTunes Store launched, solving the industry's piracy problem with a $0.99-per-song model."
The LLM extracts 7 facts: "iPod released in 2001," "Toshiba 1.8-inch micro hard drive," "5GB capacity," "Click Wheel," "FireWire high-speed interface," "iTunes Store launched in 2003," "$0.99 per song pricing."
Model B writes the same section as:
"The iPod's debut was undoubtedly a milestone in digital music history, completely transforming how people access and consume music. With remarkably forward-thinking product philosophy, Apple packed 5GB of storage into a handheld device, pioneering an entirely new era of portable music players. The subsequent iTunes Store reshaped the entire music industry's landscape with its disruptive business model."
On the same topic, the LLM extracts only 2 facts: "5GB storage space" and "launched iTunes Store."
Everything else is evaluation and embellishment — "milestone," "completely transforming," "remarkably forward-thinking," "entirely new era," "disruptive business model," "reshaped the landscape." Model B's word count is similar to Model A's, but its information density is less than one-third.
Research Bench covers 9 mainstream vendor models across 36 research topics, spanning technical research, industry analysis, company research, and other deep research scenarios.
The "Information Density" evaluation method uses Agent as a Judge, with an LLM reading each report, extracting facts point by point, then calculating and horizontally normalizing the number of information points across models for the same report, mapping final scores to a 10-point scale.
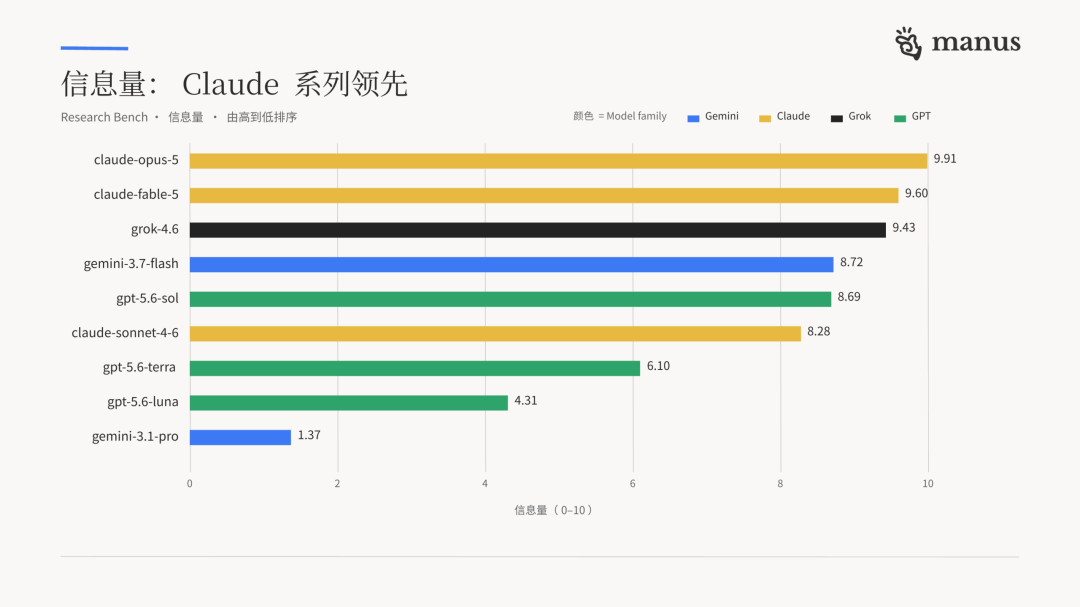
In our eval results, GPT's flagship model lags behind Claude series models on "Information Density."
Meanwhile, GPT scores higher on another metric, "Detail Richness" — the writing feels very substantial. This means in our testing, GPT models have lower information density than Claude models.
To understand why GPT's information density was lower, we analyzed tool call distributions during information gathering and found GPT's average Search tool calls were even higher than Claude's.
If low information density isn't from less information exposure, perhaps some information loss is occurring.
Following this thread, I found GPT and Claude behave significantly differently when writing intermediate research notes.
Claude records key facts and data from each source directly as bullet points.
GPT tends to write complete 100-200 word summaries for each source. At this stage, GPT suffers greater information loss, affecting final report information density.
After identifying this issue, we standardized GPT's note-taking approach through prompting, effectively improving GPT's final report information density.
02
Metaphor Rate
When evaluating a research report, what people likely care about most is: how readable is this text?
This has long troubled us — can we quantify writing style?
We could crudely have an LLM rank or score several reports' readability. But we dislike this as a metric — it's not reliable or stable, the scores lack explanatory power, and it doesn't help us solve actual product problems.
Then Fable appeared. We noticed it consistently uses "fat" and "thin" to describe file sizes, "arms" and "legs" to describe group concepts, and "first-class citizen" to describe the standout element in a set.
These inspired us to build a metric that measures model writing style indirectly — "Metaphor Rate." Metaphor is a common linguistic phenomenon, simply understood as "quietly" using comparison in a sentence.
Feel this high-metaphor-rate sentence:
"The full-stack AI empire leads its evaluation legions and annotation armies to charge at global Tier 1 clubs, embarking on the next phase's marathon."
"Leads," "charge at," and "embarking on" are obvious action metaphors; "AI empire," "evaluation legions," "annotation armies," and "global Tier 1 clubs" together construct imagery of competition and conquest.
But this could simply be written: "The full-stack AI system comprises an evaluation team and large-scale annotation team, aiming to break into the first tier and participate in the next phase of long-term competition."
Metaphor makes the sentence more abstract and complex. Your brain needs processing to还原 it to plain meaning, reducing report readability.
Metaphor's existence hopes to aid understanding by comparing unfamiliar, abstract concepts to more familiar ones. But LLMs' high-density, inappropriate metaphor use likely expresses abstract concepts... even more abstractly.
Moreover, mathematically speaking, metaphor's more essential impact is: as a "language function" mapping word x to word y (y=f(x)), it necessarily causes information loss, because y's information content is always less than or equal to x's.
In summary, we constructed the metaphor rate metric: how many metaphorical expressions appear per hundred sentences. Through metaphor rate, we can reflect a model's writing characteristics from one perspective — higher metaphor rate typically means harder-to-read reports with information loss.

In practice, we similarly use Agent as a Judge, testing 36 Chinese and English research reports across different topics from 9 mainstream models. Multiple models' reports on the same topic are processed in one session to ensure relative comparability.
The prompt's core constraints: exclude metaphors fully assimilated into daily usage (like "field," "run," "face challenges" — words completely naturalized) and terminological metaphors (like "neural network"), and require each annotation to output a literal replacement.
If a "metaphor" can't be stated more plainly, it's probably not a metaphor — this reverse-checks annotation quality.
For sentence segmentation, Chinese uses periods, question marks, and exclamation points; English uses standard sentence tokenizers. Markdown header lines, table rows, and pure link lines don't count toward total sentences.
Take one test question as an example: Review Sony and Nintendo's gaming console technology advances over the past two decades, analyzing how hardware performance influenced game development and consumer experience?
In this question's results, Fable 5's metaphor rate was 9.63 — 18 metaphors in 187 sentences, such as: players piecing together truth like archaeologists, open structure as difficulty adjuster, Gothic and cosmic horror seamlessly stitched together, etc.
GPT 5.6 Luna's metaphor rate was only 1.44 — just 2 metaphors in 139 sentences, such as: advancing the previous installment's zoned structure to mutually interlocking, shortcut-looped vast continuous world.
Here are the final results:
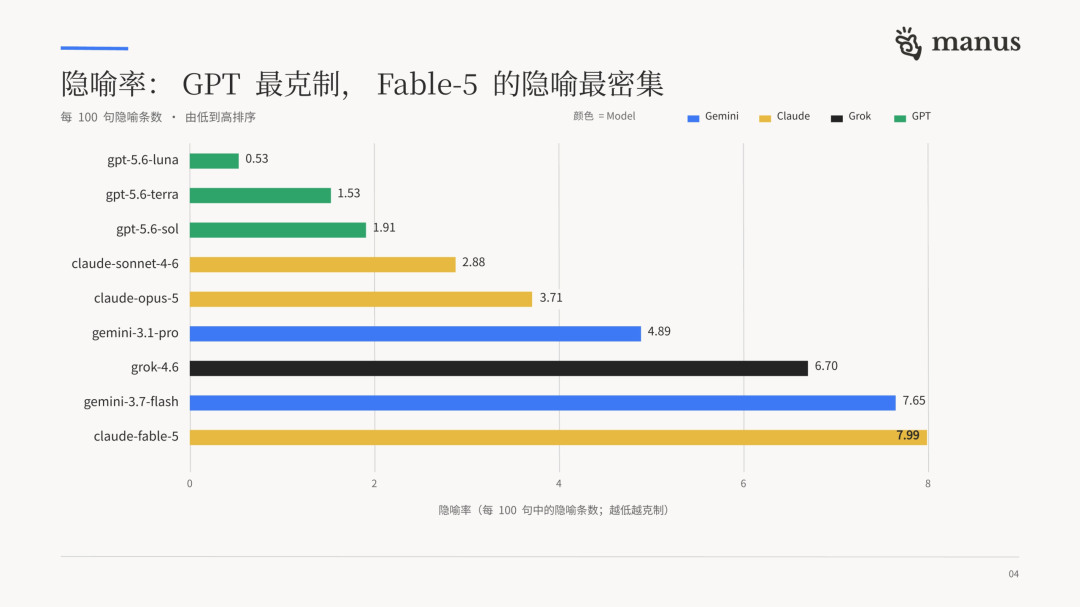
The conclusion: under this round's topic set and evaluation configuration, GPT 5.6 series models are more restrained in metaphor use.
Claude Fable-5 has the highest metaphor rate. Fable favors body and organism-related expressions — "rubber lineage," "eroding community soul," "pyramid overall elevation," "stirring value system."
Opus-5's metaphor rate is noticeably lower than Fable's, with more academic-style usage, such as "outsourcing safety to materials," "function of climate," "using data as language."
Gemini-3.7-flash's samples tend toward grand vocabulary — "golden decade," "dual-engine drive," "blood," "territory," "tide," "genes" — concentrated at chapter openings and closings, expressions also common in financial media.
Grok-4.6 uses many business and competitive analysis metaphors: "arms race," "crown jewel," "moat," "chess game," "catalyst."
Of course, metaphor rate is just one of many perspectives on report readability, and low metaphor rate doesn't absolutely mean easier reading.
But if we can build many concise, actionable signals like metaphor rate around a report, this helps us understand model characteristics.
Returning to the two dimensions for measuring a report: 1) What information does the report contain? 2) How is this information organized?
These dimensions still have numerous signals to mine: reference quality, information accuracy, detail richness, viewpoint nesting degree, long-short sentence rhythm, etc.
Even for information density alone, unfinished topics remain — such as how to prevent a model from increasing fluff while increasing information density, etc.
How to quantify subjective feeling through a concise, elegant entry point is what most deserves careful thought. A metric's effectiveness also needs long-term online data tracking for validation, ultimately filtering out signals that withstand scrutiny and truly guide product iteration.
Evaluation is complex engineering. Beyond signal building, how to construct your product's unique evaluation set, how to design online experiments, how to build effective and robust automated evaluation systems — these are all fascinating topics.
Today's sharing may not cover macro insights about Evaluation, but rather shares some of our experience through actions we're practicing, perhaps somewhat dry ones. I'd be very happy if this could spur more related actions.
(This article's cover image was generated by ChatGPT; purely human-written)