MaKe | DeepWise and Moonshot AI Jointly Release Latest AI + Life Sciences Practice

Source Code Capital was an early investor in DeepWise and Moonshot AI, and has accompanied and supported both companies ever since.


MaHui member company DeepWise and Moonshot AI have jointly released their latest AI + life sciences practice: tailored to biomedical research scenarios, the research agent BioMaster, launched by DeepWise on its Bohr Scientific Space platform, is now officially integrated with Kimi K3.1 Pro to support biological research tasks such as single-cell analysis, genetic variant interpretation, and paper analysis reproduction.
BioMaster integrates biological domain knowledge, a professional research toolchain, and computational execution capabilities to turn research questions into executable, verifiable analysis workflows. By combining Kimi K3.1 Pro's ability to understand complex tasks, reason, and generate code, researchers can submit questions, data, and analysis requirements through BioMaster to complete continuous research tasks spanning analysis planning, computational execution, and result organization — while retaining code, parameters, charts, and run records for verifying results and carrying out follow-up research.
BioMaster supports integration with multiple foundation models and will evaluate and invoke the optimal model according to different task requirements. This article focuses on Kimi K3.1 Pro's actual performance in this evaluation.
Key results:
- Kimi K3.1 Pro paired with Kimi Code achieved the highest score in DeepWise's internal biological research benchmark.
- Single-cell analysis completed in 90 minutes, roughly 63% faster than the manual reference time: inferring differentiation trajectories from the expression data of 3,696 pancreatic cells and screening out 100 candidate genes.
- Microbial functional analysis completed in 35 minutes, saving about 85% of analysis time: comparing 5,616 functional entries across 25 coastal environmental samples and identifying 5 research directions.
1
From reproducing existing work to validating new ideas
Before designing the next round of experiments, researchers typically need to assess how well existing data supports their research hypotheses. For example, whether a phenomenon reported in a paper can be observed in another batch of samples will affect the design of follow-up experiments and the direction of research.
To this end, researchers often need to obtain the data and code used in a paper, reproduce the original analysis, and then analyze new samples using the same methods. If the two results differ, they must also check sample grouping, analysis parameters, and experimental conditions to determine which factors may affect the study's conclusions. These processes involve multiple steps — literature comprehension, data processing, analysis method selection, and computational execution — and require not only domain expertise but also coordination across different research tools and computing environments.
To address these needs, BioMaster integrates domain knowledge, professional tools, and computing resources into a unified research workflow. Leveraging Kimi K3.1 Pro's long-context understanding and reasoning capabilities, BioMaster can combine method descriptions, figures, analysis code, and experimental setups from papers to map out the analysis steps that need to be reproduced or adjusted, and support subsequent computational execution. The data, code, parameters, and results used during analysis are retained, allowing researchers to check discrepancies, adjust analysis conditions, and discover research leads from existing work that merit further validation.
2
Kimi K3.1 Pro's measured performance
Research agents like BioMaster demand more from foundation models than understanding scientific concepts and answering professional questions — they must also handle complex research requirements, generate executable code, and maintain an understanding of data, analysis goals, and context across continuous tasks.

To evaluate whether a foundation model is up to the job of a research agent, DeepWise focuses on how well it works with BioMaster's tools and computing environment, examining four key stages:
-
Literature retrieval and data acquisition. Understanding the research question, locating the needed information from literature, databases, and user-provided materials, assisting with data acquisition and organization, and verifying sample and experimental context to establish a clear starting point for subsequent analysis.
-
Analysis planning and tool execution. Facing different types of biological data and research questions, selecting appropriate methods, writing code, invoking professional tools, and connecting steps such as data cleaning, quality checks, statistical analysis, and modeling to move analysis from idea to actual results.
-
Result interpretation and scientific visualization. Interpreting analysis results in the context of the research, selecting appropriate charts to present data distributions, between-group differences, or variable associations, clearly expressing comparison targets, key findings, and their implications, and helping researchers understand results and determine the next research direction.
-
Multi-step coordination and report delivery. Maintaining consistency of research goals, data, and parameters across continuous analysis, organizing methods, results, charts, and key conclusions into a report, and retaining reusable data and code for researchers to verify, communicate, and continue their work.
To evaluate how well different models adapt to professional research workflows, DeepWise conducted a benchmark of models and agent execution frameworks in the biological domain. In this internal evaluation, Kimi K3.1 Pro paired with Kimi Code ranked first among the combinations tested.
On this basis, DeepWise** further tested the combination of BioMaster and Kimi K3.1 Pro on three biological benchmark sets targeting BioMaster's real-world application scenarios. The results show that BioMaster paired with Kimi can complete research retrieval, computation, and professional Q&A, as well as analyze given biological data and answer questions about sample origin, grouping, and other matters that require computation to determine.**
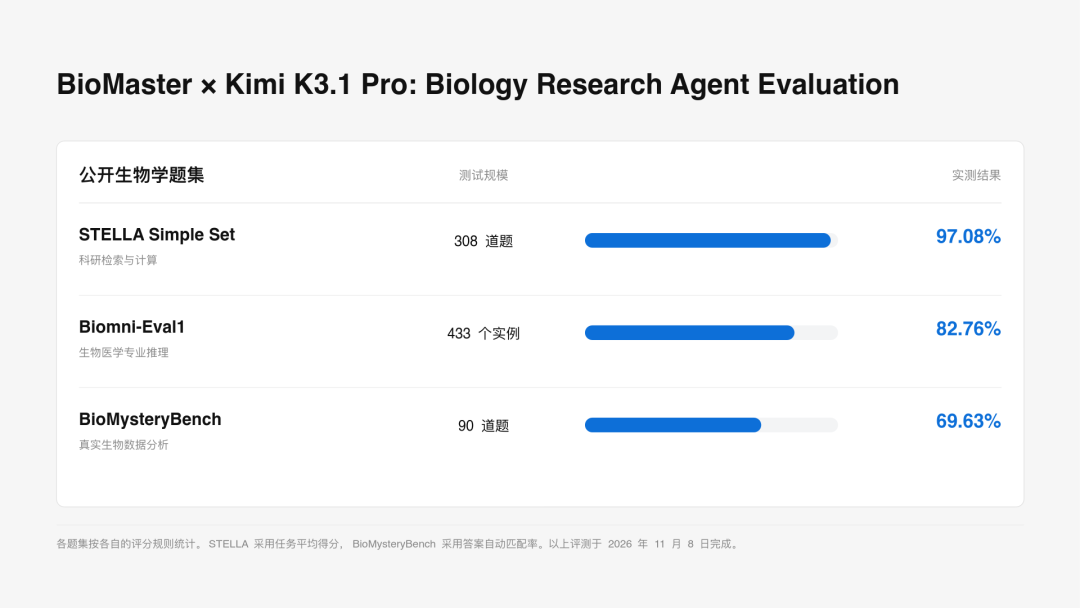
Benchmark set overview:
- STELLA Simple Set: Research retrieval and computation. Retrieving biological databases and web resources to answer questions about experimental procedures and computation.
- Biomni-Eval1: Biomedical reasoning. Screening candidate genes, analyzing genetic variants, or inferring causes of rare diseases based on research context.
- BioMysteryBench: Biological data analysis. Analyzing anonymized biological data to determine sample origin, identify sample groupings, or detect genetic variants.
3
How to use BioMaster and Kimi for research analysis
Researchers can pose research questions through BioMaster, provide relevant data, and specify analysis requirements.
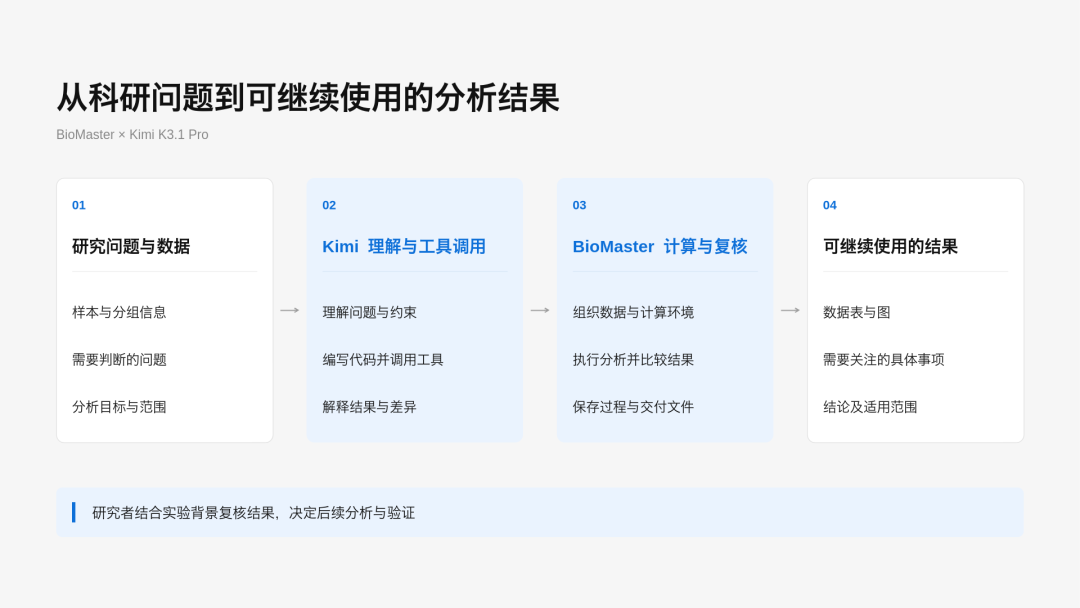
BioMaster + Kimi: understanding research questions, completing computation, checking judgments, and delivering results
BioMaster combines biological domain knowledge and professional skills, using Kimi K3.1 Pro to determine analysis methods, write code, and invoke tools, and relying on the platform's computing resources and runtime environment to support data processing, computational analysis, and result organization — while retaining the relevant code, parameters, charts, and run records.
After analysis is complete, researchers can not only view the conclusions in the report but also trace back the analysis methods and computational process, compare results under different analysis conditions, and build on existing results for further research.
4
Three research analysis case studies
The following three cases cover different types of research tasks — single-cell analysis, microbial functional analysis, and physiological signal analysis — demonstrating the application of BioMaster and Kimi K3.1 Pro in real research analysis workflows.
① Single-cell analysis
Inferring differentiation trajectories from 3,696 pancreatic cells and screening out 100 candidate genes
- **Manual time reference: 4–8 hours (effective work time)
- **BioMaster + Kimi: about 90 minutes
In the mouse pancreas at embryonic day 15.5, there are both endocrine progenitor cells and cells that have already taken on distinct differentiation characteristics. To infer the developmental order of these cells, BioMaster invoked Kimi K3.1 Pro to plan the analysis steps, starting from the gene expression data of 3,696 cells, verifying 8 major cell populations, and then combining pseudotime and RNA velocity to infer the direction of cell state changes.
The results suggest that cells may progress from an earlier ductal-like state through endocrine progenitors and intermediate states toward different endocrine branches. The entire analysis took 90 minutes.
The analysis results the researchers obtained included a cell developmental map, a list of 100 candidate genes, and accompanying scripts, data, and a 6-page report. Researchers can select a branch, use marker genes to verify the stage the cells are in, then examine the expression changes of candidate genes along the inferred developmental order and pick out genes worth prioritizing for validation.
Result 1: Reading cell populations and possible directions of change on a single cell map.
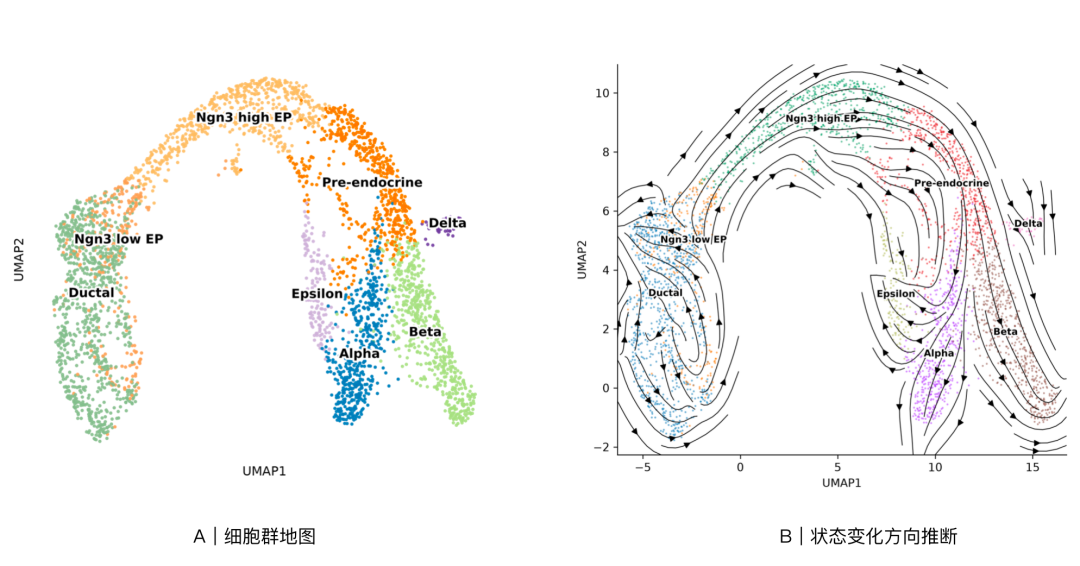
▲ In panel A, each dot represents a cell, with colors distinguishing the 8 major cell populations. Panel B overlays streamlines on the same cell map, with arrows indicating the direction of cell state changes inferred from RNA velocity.
Result 2: Using gene expression to check whether the interpretation of cell populations is reasonable.
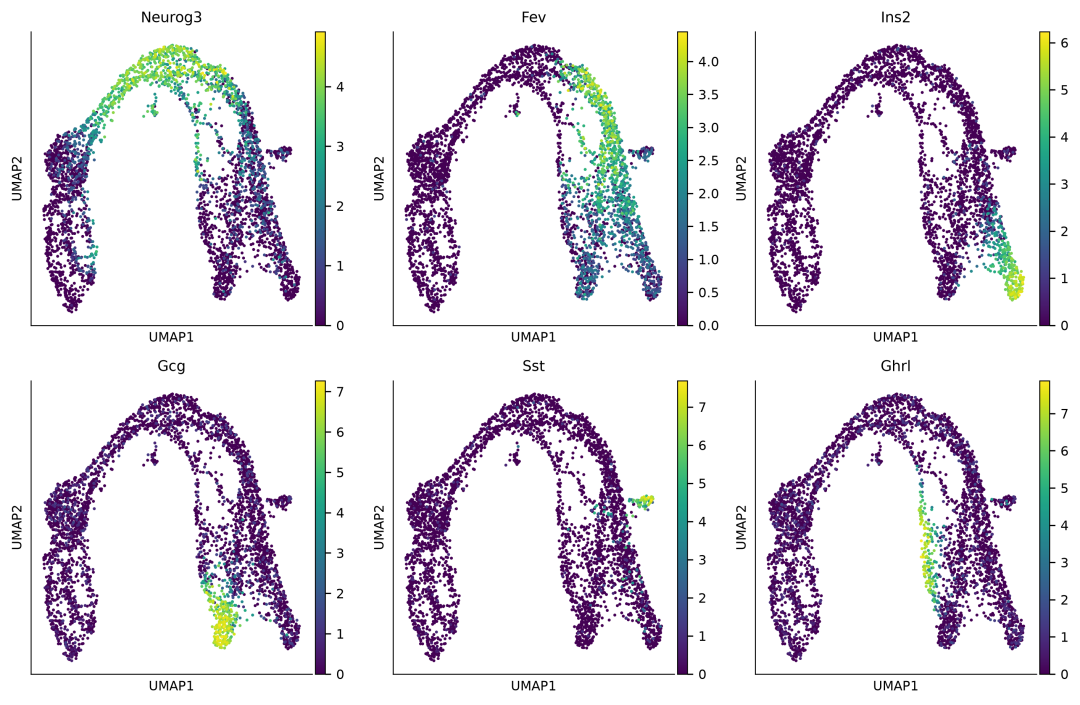
▲ Six panels show the distribution of six representative genes — Neurog3, Fev, Ins2, Gcg, Sst, and Ghrl — on the same cell map. Neurog3 expression is concentrated in the endocrine progenitor region, while Ins2 and Gcg are concentrated in the β and α cell branches, respectively, providing a basis for identifying these cell populations.
② Microbial functional analysis
Identifying 5 research directions from 5,616 microbial functional entries
- **Manual time reference: 4–8 hours (effective work time)
- **BioMaster + Kimi: about 35 minutes
The functional composition of marine microbial communities is influenced by multiple environmental factors. Analyzing functional differences across sampling sites helps researchers understand the potential metabolic characteristics of microbial communities and further screen for biogeochemical processes worth attention.
Using Kimi K3.1 Pro, BioMaster completed microbial functional analysis of 25 coastal environmental samples from three coastal sites in the Baltic Sea within 35 minutes. Preliminary analysis showed that the total KO annotation count in Ragaciems samples was lower, and the number of detected functional entries may have been affected by data coverage and assembly annotation differences. In terms of overall functional composition, Skulte samples were relatively similar to each other, while Daugavgriva samples differed considerably. BioMaster then narrowed 9,852 functional entries down to 5,616 and compared differences between sites item by item while accounting for sampling month.
Researchers obtained microbial functional comparison charts for the three sites and result tables traceable back to individual samples. For functional entries that differ between sites, researchers can view their distribution across samples, determine whether the differences are concentrated in a few samples, and then combine the completeness of related metabolic pathways and the microbial taxa present in the samples to organize five categories of directions to be validated: denitrification, methane-related metabolism, sulfate reduction, reductive carbon fixation, and photosynthetic/eukaryotic contributions.
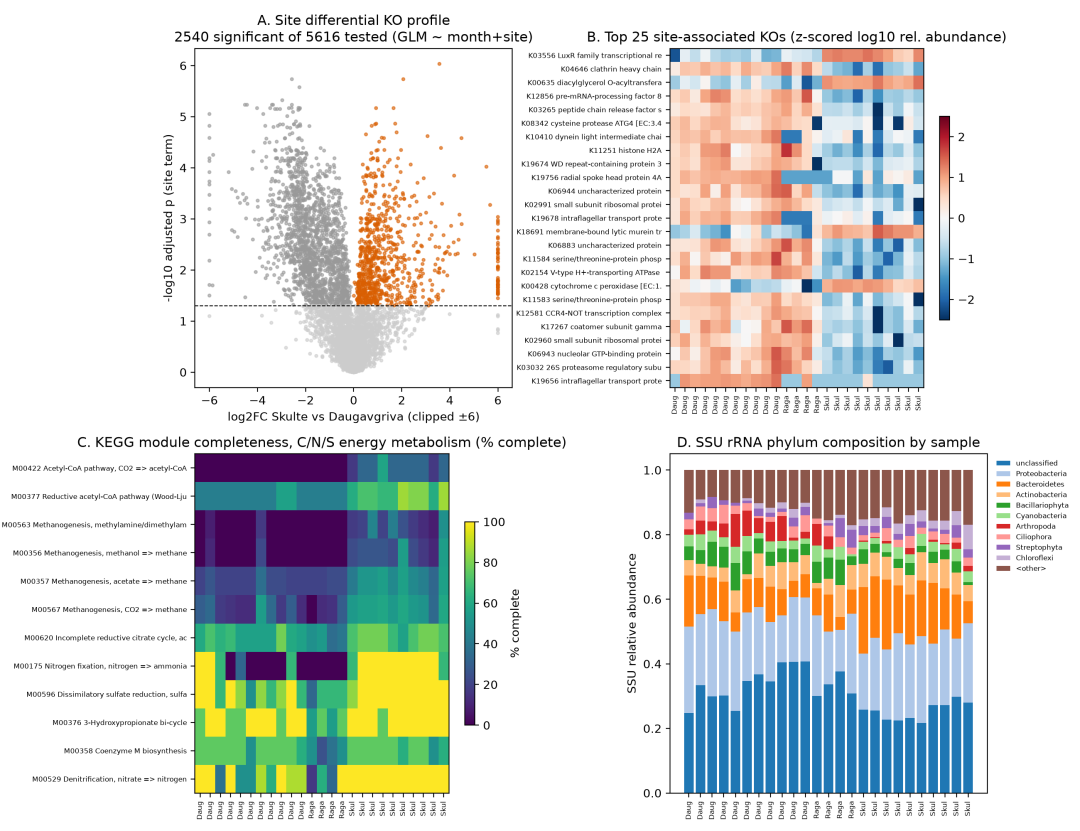
▲ Panel A shows functional entries associated with sampling site, and panel B expands the distribution of 25 representative entries across samples. Panels C and D show pathway completeness and microbial taxa composition related to carbon, nitrogen, and sulfur, respectively, for researchers to interpret functional differences.
③ Biological signal analysis
After analyzing 57 posture-change events, finding that heart rate alone cannot determine whether blood pressure has recovered
- **Manual time reference: 6–12 hours (effective work time)
- **BioMaster + Kimi: about 100 minutes
To determine whether heart rate alone can indicate blood pressure recovery after posture changes, BioMaster used Kimi K3.1 Pro to analyze ECG and continuous blood pressure recordings from 10 healthy volunteers during active standing, rapid tilt, and slow tilt. BioMaster aligned the two signal channels starting from the moment of each posture change, determined event by event whether heart rate and mean arterial pressure*()* reached their respective recovery criteria, and completed the analysis report within 100 minutes.
Researchers ultimately obtained heart rate and blood pressure change curves under the three posture maneuvers, along with recovery records for each event. According to the recovery criteria used in this analysis, of 57 valid events, 30 showed mean arterial pressure had recovered while heart rate had not. This provides a basis for equipment selection in the next round of experiments: if the research goal includes determining when blood pressure recovers, it is necessary to continuously monitor blood pressure alongside ECG recording.
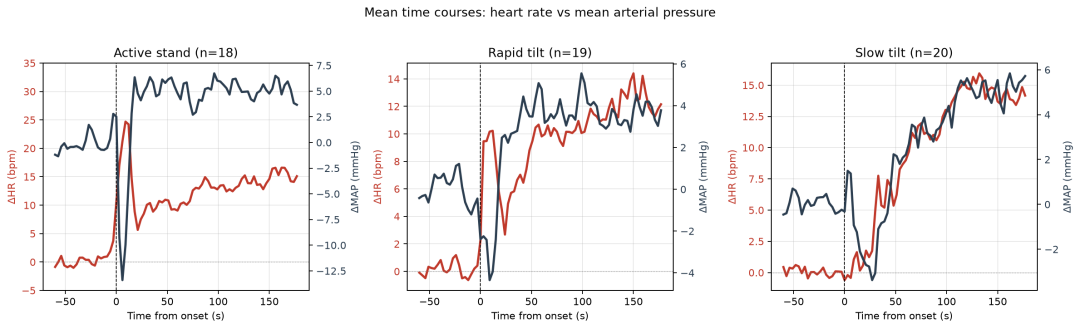
▲ From left to right: active standing, rapid tilt, and slow tilt, with 18, 19, and 20 valid events included, respectively. The red line shows heart rate change (left axis), and the dark line shows mean arterial pressure change (right axis). The curves show group average trends; recovery counts in the text are tallied per individual event.