Microsoft Research Asia's Zheng Yu: AI Applications in Urban Management and Business

AI and big data are racing to penetrate every corner of business and daily life. In the future, every company may be a big data company, an AI company — just as every company is now an internet company.
AI and big data are racing to penetrate every corner of commerce and daily life. In the future, every company may become a big data company, an AI company — just as every company today is an internet company.
Understanding how artificial intelligence is applied in urban management and business will help every entrepreneur empower their products and business models in practice.
Dr. Yu Zheng, head of the "Urban Computing" domain at Microsoft Research Asia, shared the progress of AI in urban computing at Source Code Capital's 2017 Ma Hui.
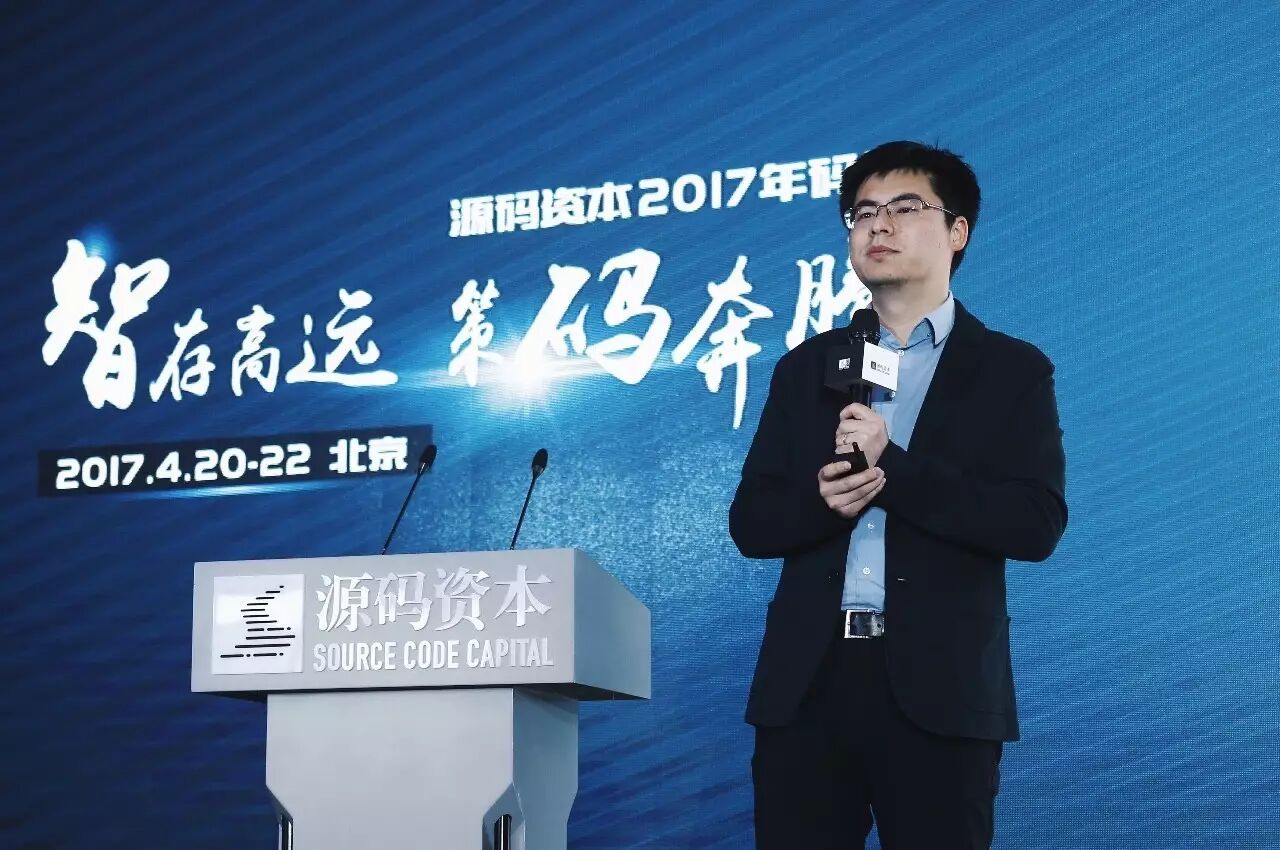
Dr. Yu Zheng
Senior researcher at Microsoft Research Asia and head of the "Urban Computing" domain, Secretary of ACM SIGKDD China (KDD China), visiting professor at Shanghai Jiao Tong University, visiting professor at The Hong Kong University of Science and Technology, and editor-in-chief of ACM TIST, a top-tier international AI journal (SCI Q1). He has led the development of multiple urban big data systems, including Urban Air, the first system to use big data for monitoring and forecasting fine-grained air quality. The service covers more than 300 cities in China and has been adopted by China's Ministry of Environmental Protection. He led the design and implementation of an urban big data platform, which was successfully deployed in Guiyang, a national big data demonstration zone. In 2013, he was named one of MIT Technology Review's "Innovators Under 35" (TR35), and as a representative of modern innovators, he appeared on the cover of TIME magazine. In 2014, Wealth selected him as one of China's 40 Business Elites Under 40 for his leadership in urban computing, which has enormous commercial potential and the power to transform industries. In 2016, he was named an ACM Distinguished Scientist.
The following is the transcript of Dr. Yu Zheng's speech at the 2017 Ma Hui:
I'm very glad to have this opportunity to share with you our work in the field of Urban Computing. You often hear about AI being used for voice, image, and text. I'd like to explore how AI and big data technologies can transform our lives — specifically, the progress of AI in urban domains.
Applying AI in urban domains requires four areas of expertise:
Understanding urban culture itself — pure theoretical knowledge from data scientists cannot replace industry expertise;
Understanding the data itself — not just its surface characteristics, but also the knowledge embedded within it;
Mastering data science models, including data management, data mining, machine learning, and visualization;
Knowing how to use cloud platforms to efficiently deploy algorithms to solve problems.
In the urban domain, these four points have distinctive applications:
You can imagine that cities contain vast amounts of data — from Lianjia, from SouFun, from geographic information to human traffic flows — seemingly hundreds or thousands of different types. In fact, if we classify by data structure, there are two types: point data and network data. If we classify by spatiotemporal attributes, there are three categories. So in total, there are six types. The most complex of these six is trajectory data, because an object's location and the attributes at each location are constantly changing over time, and there are correlations between points. The trajectories of Mobike and DiDi vehicles both fall into this category.
I don't want to face a thousand types of data and have to build a thousand models and algorithms, making the system extremely complex. We hope that once the model is defined, no matter what data comes in, we can efficiently use the platform and corresponding analysis and mining algorithms to process it.
Urban domains have massive data that is multi-source, multi-modal, and changes very rapidly. How do we quickly update such complex data and deploy it at scale? A platform is essential. Naturally, you'd think of connecting everything through a cloud platform. Unfortunately, no commercial cloud platform can handle spatiotemporal big data well — their support for urban big data is inadequate.
Limitations of existing cloud platforms in processing urban big data, and MSRA's practice:
The data structures are very different from those of images and text.
The query methods are different. For example, when looking for a DiDi ride, we want to find available cars nearby within a specific time window, not enter keywords to match text.
In urban computing, we often use multiple data sources rather than a single one. For air quality prediction, we need meteorological, traffic, geographic, and human mobility data. How to manage these diverse data sources together? This is a difficult problem, and the technology is missing. For these reasons, existing cloud platforms cannot adequately support spatiotemporal big data.
Constrained by the limitations of existing cloud platforms, Microsoft Research Asia deployed China's first urban big data platform in Luoyang last year.
It first defined six data models, then leveraged the storage resources of Microsoft's existing cloud computing platform. We then built a middleware layer, designing spatiotemporal indexing algorithms for different data structures and hybrid indexing algorithms for different data types. We integrated spatiotemporal indexing into distributed computing environments such as Hadoop, Spark, and Storm.
This layer contains not only distributed computing environments but also spatiotemporal indexing algorithms. The combination of the two makes data access, management, and storage highly efficient. Finally, it provides APIs to upper-level machine learning and AI algorithms, enabling them to quickly access underlying data. Imagine, without this layer, many machine learning algorithms could never go live or operate at scale.
The following application cases demonstrate the practical effects of this urban big data platform.
1
Urban Charging Station and Billboard Placement
Using the urban big data platform in Guiyang, we determined where to place charging stations to maximize coverage of urban traffic flow. We selected five intersections that would maximize coverage of different taxi GPS trajectories.
This work used to take a day. Now we get results in 2-3 seconds. We found that in commercial applications, deployment requires not just data science support but also industry knowledge. We must consider not only traffic flow maximization but also whether there are shopping malls nearby, whether supporting facilities exist. During the two-hour charging wait, drivers need nearby dining and entertainment options.
We achieve the combination of human intelligence and AI through visual interactive analysis. AI first uses simple rules and algorithms to feed back preliminary results for industry experts to judge. If an expert thinks a location is unsuitable, they can remove it, or keep it and recalculate — achieving an iterative, interactive mining process.
This case demonstrates the power of the platform, the power of performance, and truly combining machine intelligence with human intelligence.
Beyond charging stations, this model can also analyze commercial store location selection and billboard placement — cases that demonstrate the data management power of the urban big data platform.
2
Home Price Evaluation
Our urban big data platform also has a dedicated data analysis layer containing three sub-layers: general machine learning algorithms, machine learning algorithms specifically designed for spatiotemporal data, and multi-source data fusion algorithms.
Let's look at this example. We want to rank home values, not predict prices. That is, in the same Beijing market, if prices rise, which ones rise more? If they fall, which ones fall relatively slower?
Under the same conditions, excluding policy and environmental factors. We rank properties by their appreciation ratio, ordering them 1-2-3-4-5, with Category 1 being the best and Category 5 the worst (slowest to rise, fastest to fall). Li Ka-shing said a property's value is determined by three things: location, location, and location. These three "locations" can actually be quantified with data.
The first location is the level of surrounding facilities and amenities — transportation, shopping malls, schools — all learnable from road networks and POI data. Similarly designated school zones can have vastly different impacts on home prices depending on whether the school is elite or ordinary. A good mall versus a run-down one creates huge gaps in location value.
So there's a second location: Popularity — people's travel patterns matter enormously. People's movement patterns already characterize a place's value. If people in one area mainly take buses and subways, while in another they mainly drive or take taxis — which area do you think is more upscale? Human behavior can characterize a location's form.
The third location is the property's business district. Not every property in Wangjing is equally good — we need 7-8 types of data to characterize this location's value.
From each data source we can extract many features for calculation. For example, how many bus stops are near this property, how far is the nearest bus stop, how far is the nearest subway station — then we can turn this into a ranking problem. This demonstrates that it's not a problem solvable by a simple algorithm. Many features are redundant, not fully independent, with high correlation, and many features are non-linear, so we need to add many constraints.
How do we validate? We use 2013-2014 housing data to predict 2015's ranking, and after 2015 we naturally know the results. Using SouFun's data, the accuracy is very high — NDCG basically reaches above 95%, which is an excellent result.
This technology has also been applied to hot pot restaurant site selection in Shanghai and valuation of urban commercial complexes. For first-tier Chinese commercial brands like Wanda and Poly Plaza, comprehensive commercial evaluation is very difficult, but our method adds value. 2016 data already showed which of Beijing's 100+ commercial complexes appreciated fastest and were most worth investing in, forming a ranking. This ranking is also applied in bank credit evaluation, helping banks assess comprehensive commercial complex value to determine loan amounts and collateral values — using AI to evaluate long-term price appreciation trends.
3
AI + Ride Sharing
DiDi and Mobike — these two cases are closely connected with AI.
First, ride sharing. The taxi industry truly achieves sharing only when it reaches ride sharing, so ride sharing is the ultimate goal. The original purpose of ride sharing was to resolve the contradiction between excessive urban vehicles and the difficulty of getting rides. The idea emerged under the premise of hoping not to increase total vehicle numbers. To ensure user experience, ride sharing must guarantee that users arrive at destinations at their desired times.
Using AI to find one vehicle to pick up this person with truly minimal distance is an optimal solution. But are there other vehicles that could satisfy the passenger's arrival time, while also seeking the passenger's willingness to share? If your arrival time could be delayed by five minutes but you'd save five dollars, would you be willing? In ride sharing schemes, guaranteeing passengers arrive within specified time is key.
Dynamically balancing vehicle distance, expected arrival time, and price to maximize user satisfaction is a very difficult problem. These demands exceed what human thinking can achieve — AI must handle the re-scheduling.
Using AI simulation, we treat a taxi as a truck and a person as cargo — the pickup point as the collection location, the passenger's destination as the delivery location. We applied this in cooperation with SF Express, increasing SF's throughput efficiency by 5-10% without adding personnel.
After achieving current optimization, future optimization becomes even more important. This involves deep learning.
Take logistics as an example. Future logistics requires three things: prediction, cumulative optimization, and spatiotemporal indexing — all three combined.
Suppose we divide one kilometer into many grids. We can predict how many people will enter and exit, predict future requests for Mobike, for DiDi, for Ele.me orders. We've already started doing this prediction in Guiyang — predicting how many taxis enter and exit each grid, predicting how many Ele.me orders will be requested in a location. We use this data to validate our model's correctness.
The original motivation for using deep learning to predict human flows and order volumes came from the Shanghai stampede incident. After the stampede, I wrote a Weibo post with great sorrow, saying this could have been prevented through AI prediction. If we had known two or three hours in advance how many people would go to that location, we could have diverted people at the source, rather than waiting until everyone arrived to disperse them. If government could predict the magnitude in advance, it could prepare safety measures ahead of time.
Similar public needs apply to Beijing's subway system; commercial needs apply to DiDi, Mobike, and Ele.me.
But predicting human flow is difficult because there are so many relevant factors. Moreover, spatiotemporal data differs from text — space has distance and hierarchy, time has periodicity and trend.
For example, traffic capacity changes daily. We must consider temporal periodicity, trends, and recency; spatial proximity; fusing different data sources; and different influence factors at different levels. Finally we get good results. This has been validated with Beijing taxi data, US bike-sharing systems, and now with Mobike — all performing much better than previous methods.
4
Urban Computing in Air Quality
Microsoft Research Asia once used big data and AI algorithms to predict air quality for over 200 cities nationwide.
Because air quality is affected by many complex factors — surrounding building density, traffic congestion, diffusion conditions — air quality is uneven across cities.
We combined data from the Beijing-Tianjin-Hebei, Pearl River Delta, and Yangtze River Delta city clusters for large-scale series prediction and analysis. With this information, you can discover during each air quality deterioration process where it turns bad first and where later, understanding its propagation path. Government clearly needs very fine-grained air quality data, even down to the hotel level, because sometimes our leaders stay at certain hotels.
Predicting the future. My prediction is series prediction. Air quality prediction must consider both nature and human factors — a very difficult task. If you want fine granularity, down to how Xizhimen or Dongzhimen is doing? Very difficult. There's also air quality inflection point prediction. We know when strong winds or heavy rain occur, air quality instantly drops from 500 to 50. The appearance of this inflection point is extremely important to government.
Why is the air quality inflection point so important? For example, government once implemented many measures — traffic restrictions, factory closures in Hebei, drawing a circle around Beijing and shutting all factories inside — to keep air quality below 100. But if you know tomorrow is an inflection point and air quality will drop, why shut them down? This one decision could save the country tens or hundreds of billions in losses.
Microsoft Research Asia also deployed China's first traffic flow map in Guiyang. This shows vehicle flow, not simply speed. For government management and planning, knowing how many vehicles pass through is essential — that's flow. With flow we can calculate speed, fuel consumption for each road segment, and further calculate real-time PM2.5 emissions for each segment. Now we can calculate vehicle exhaust emissions, combine them with air monitoring station readings, and correctly answer what percentage of PM2.5 in the air comes from vehicle exhaust — which has important significance for government guidance.
Four Keys to Building Truly Smart Cities
First, understand industry knowledge. If I don't understand environmental science, don't communicate with environmental scientists, and don't know what they've done, then they in turn cannot accept big data analysis results.
I've been working on environmental issues for over two years. Now Tsinghua University's School of Environment invites me annually to teach graduate students — only at this level of integration can we truly merge with other industries.
Second, understanding data is crucial. Taxi traffic trajectories on roads don't just reflect taxi traffic capacity — they also reflect people's travel patterns. Travel patterns reflect functionality, economics, and environmental conditions. Thinking this way, you'll find we never lack data. In the big data era, we don't lack data; what we lack is open-mindedness. Big data's value lies in fusing multiple data sources to achieve 1+1>2 results — that's its characteristic and charm.
Third, deep learning. We see various algorithms — not just machine learning, but deep learning, machine learning, data mining, and databases. Many methods combine indexing, learning, and simulation; many fuse data together.
Fourth, data scientists. Data scientists are extremely difficult to cultivate — training one takes at least 7-10 years. Many projects, once they have this one person, can bring everything together. A good data scientist stands on the cloud platform, examines problems, thinks about data, observes models, then deploys models to the cloud platform to solve living problems. That's what a data scientist is.