The Pitfalls of Tech Prophecy | Source Code Capital Insights

From a once-famous victory to once-heavy skepticism, mapped against Gartner's Hype Cycle — Source Code Capital's analysis and research are presented in the seventh issue of [*Source Code Capital Internal Reference*].
Source Code Capital Internal Reference
Issue 7
About the Author
Xiaoliang Wang
Investment Analyst

Xiaoliang Wang joined Source Code Capital in 2017. Previously, he interned at DiDi's Strategy Department and McKinsey & Company, and had a brief entrepreneurial stint. He graduated from Tsinghua University's School of Economics and Management.
Contact: wxl@sourcecodecap.com
[ Editor's Note ]
It shot to fame by correctly predicting the dot-com bubble, and for two decades has remained one of the most frequently cited models among entrepreneurs and investors. In simple form, it traces the evolution of countless technologies, yet has also faced heavy criticism for inaccurate predictions. It is the Gartner Hype Cycle. How should we interpret its true meaning? How can we better identify risks and seize opportunities beyond the curve itself? After analysis and deliberation, Source Code Capital presents Issue 7 of the [Source Code Capital Internal Reference].
Perspective
The Trap of Tech Prophecy
Research by/Source Code Capital
- All models are essentially partial silhouettes of a complex world, captured from certain angles. Those who content themselves with local clarity while ignoring unknown global factors are likely to fall into the trap of models;
- Technology itself is extraordinarily difficult to predict. Even the Gartner curve, representing industry consensus, falls far short in forecasting the trajectory of emerging technologies;
- On questions of uncertainty, pursue cognitive advantage rather than perfect prediction. Second-order thinking about change and difference helps build this advantage.
1
Skill or Coincidence?
In the summer of 1999, all of Silicon Valley was swept up in feverish euphoria. Web technology and e-commerce were on everyone's lips. Anyone not talking about the "new economy" or "new order" was written off as blind to business reality. Startups could double their valuations simply by adding an "e" or ".com" to their names. Wired magazine went so far as to predict that the world was entering 25 years of sustained prosperity ("The Long Boom").
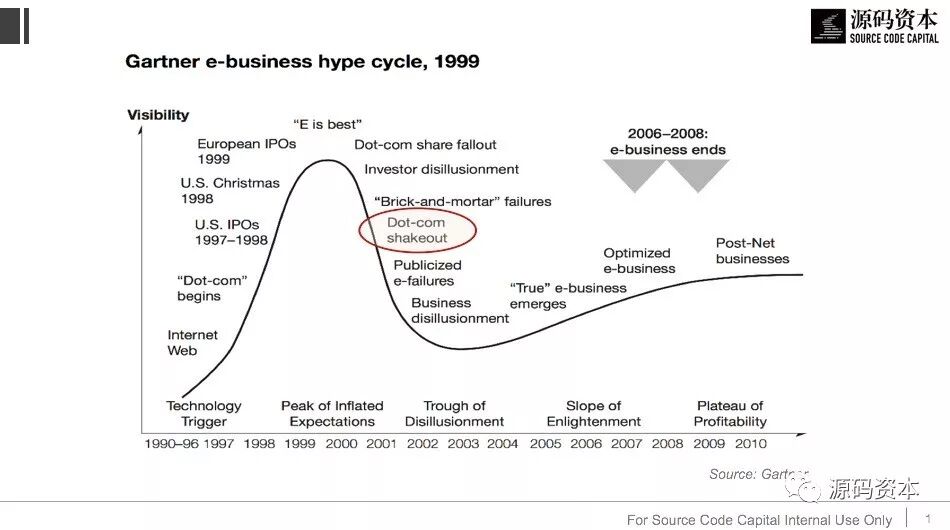
Yet across the ocean, Alexander Drobik, an analyst at Gartner's London office, felt an inexplicable chill. This IT veteran had spent years in the aviation industry and had witnessed e-commerce's mature application in airline booking and global distribution systems. To him, the e-business everyone was talking about wasn't particularly disruptive technology — certainly not enough to justify the market slapping higher price tags on companies that couldn't stop bleeding red ink than on profitable ones. He thought of the infamous South Sea Bubble of 1720, of the frenzy pushing internet companies to IPO all around him. He plotted the divergence between market expectations and technology maturity onto that undulating curve at the article's opening — an analytical tool Gartner had introduced just four years earlier — and made a bold prediction: the internet bubble would burst before 2001.
This view was so heretical at the time that it sparked considerable debate even within Gartner. After months of persuasion, the review committee finally decided to distribute the research report to thousands of clients. The date was November 9, 1999. Four months later, the U.S. stock market began crashing exactly as Alex had predicted. The NASDAQ index, after hitting an all-time high of 5,132.52, reversed sharply and was nearly halved by 2001. The Gartner Hype Cycle thus became an overnight sensation in the industry.
But more importantly, Alex didn't just predict the decline of e-commerce in 2001; he also predicted the birth of "True" e-business after 2003. In retrospect, LinkedIn (2002), Skype (2003), Facebook (2004), and Twitter (2006) all emerged during this period. This sparked industry and academic interest in the Gartner curve — can the trajectory of new technologies really be predicted?
2
Statistically "Not Accurate Enough"
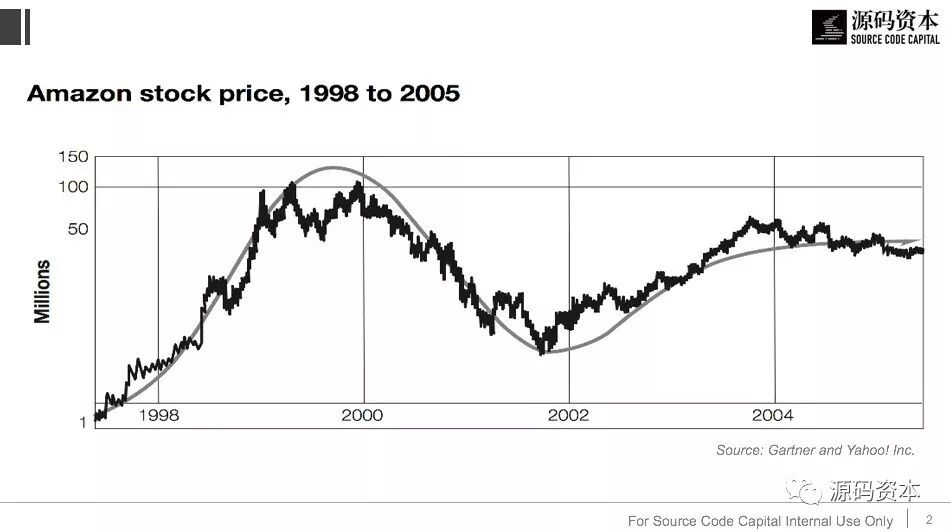
If you're willing to spend the time, you can always find more examples supporting this curve. The development trajectories of Web technology companies, for instance — Amazon and Yahoo's stock price movements between 1998 and 2005 tracked the curve quite closely. But you've probably also heard of "hindsight bias" and "survivorship bias." Many causal chains that seem traceable in retrospect were actually fraught with uncertainty at their inception. We simply filter out clues inconsistent with the present to make the narrative coherent and better fit our imagined model.
To eliminate this bias, you should ask: How many once-red-hot companies never climbed out of their trough? How many technologies hailed as promising turned out to be flashes in the pan?
In 2016, Michael Mullany, an investor at Icon Ventures, conducted an intriguing investigation. By tracing back over 200 emerging technologies mentioned in Gartner Hype Cycles from 2000 to 2016, he found:
- Among technologies that fell into the trough after the hype peak, many never climbed back out; more than 50 technologies faded from view after just one year of hype; among these, crowdsourcing (2013), HTML5 (2012), BYOD (bring your own device, 2012), and podcasting (2005), while still in use, have achieved only modest success.
- Only four major technologies were identified early and went through the curve's complete "rise-fall-rise-again" phase; they are: cloud computing (2008), 3D printing (2005), natural-language search (2002), and electronic ink (2000).
- Some hyped domains were prescient in their technological insight, but were applied incorrectly or before their market was ready, only to be revived years later, such as Web Service Enabled Business Model (2003; now adopted by companies like Twilio and Plaid), public authentication services (2002; similar to today's OAuth authentication), and trillion-scale architecture (2006; large-scale computing systems that tolerate partial failures and recover quickly).
- The curve also missed many major technologies, such as x86, NoSQL, Hadoop, and open-source technologies — they were either identified late or never appeared on the Hype Cycle at all.
In other words, if you're a CEO going all-in on black-swan technologies to leapfrog competitors, or an investor casting nets for early-stage projects based on the Gartner curve, you'll come up empty most of the time. Statistically speaking, the Gartner curve's predictions are not accurate. But if you're skilled at second-order thinking — mining blind spots that few have considered from information everyone can see — then this curve holds real value.
3
Mining Gold from Second-Order Thinking
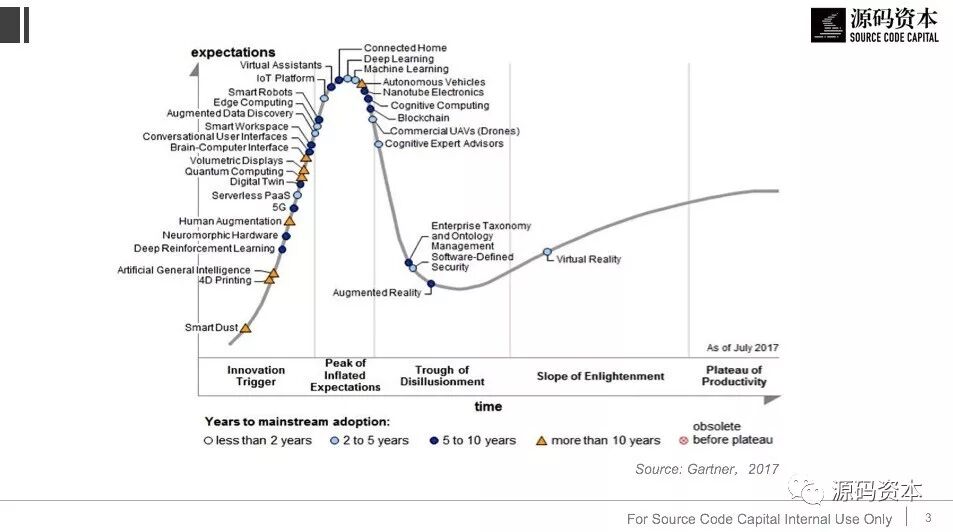
Let's start with a simple example. Below is the emerging technology curve published in July 2017, densely packed with 32 technologies. If you're an entrepreneur, investor, or consultant, what's your first impression?
- Looking at starting points, 5G technology and edge computing appear on the list for the first time, with high expectations;
- Looking at peaks, IoT platforms, deep learning, and machine learning are in full swing, expected to reach maturity within 2-5 years;
- Looking at troughs, expectations for augmented reality and virtual reality have returned to rational levels, with the industry believing that VR is gradually showing application prospects.
These conclusions are all fine. But what do they mean for entrepreneurship/investment/business management? How do you apply them to action and judgment? These are the questions we actually care about. Let's process the curve further. Taking the investment field as an example, we can draw a 4×4 matrix. The horizontal axis represents the time until widespread application, from the shortest "within 2 years" to the longest "more than 10 years," corresponding to four different markers on the Gartner curve. The vertical axis represents our assessment of commercial value, also divided into four tiers. We can then map each point on the curve onto the matrix below, adopting different investment strategies for different technologies. For example: if a technology's value is disruptive and it can achieve widespread application within 5 years, we should give it the highest research priority (corresponding to the dark red area in the figure); conversely, if a technology has high value but is more than 5 years away from engineering and commercial maturity, we should proceed cautiously or focus mainly on building knowledge reserves (corresponding to the yellow and gray areas).
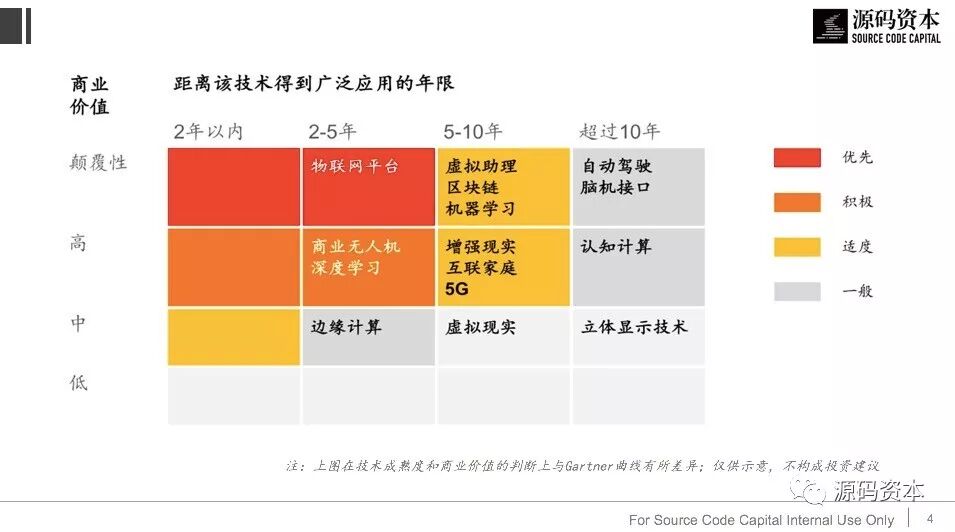
Note: The above figure differs from the Gartner curve in its assessment of technology maturity and commercial value; for illustrative purposes only, not investment advice
You can find similar matrices in Gartner's annual reports (keyword: Gartner Priority Matrix). But merely transforming the curve formally is not our ultimate goal. The value of information comes from differentiated thinking and persistent questioning about change, such as:
- Assessing accuracy: Do my assessments of technology maturity and potential commercial value align with Gartner's? Which are overly optimistic, which overly conservative? Accordingly, how should each technology's position in the matrix be adjusted?
- Identifying differences: Maturity actually has two dimensions — engineering and commercial; do different industries and countries look the same on both dimensions? In my market of interest, what stage is this technology at?
- Dynamic thinking: Which technologies appeared last year but not this year? Which disappeared before but reappeared this year? What's behind these changes? Does enthusiastic media exposure shorten a technology's maturation cycle? Which technologies might be swept away by new waves before they ever mature?
The answers to these questions determine the quality of cognition. Remember Peter Thiel's teaching: public secrets hold no value. What gives you advantage is a conviction you deeply hold that others may not share.
Limited by space, we'll only elaborate on the last question. Those interested in the others can follow Source Code Capital's articles or find more clues in the Q&A at the end.
Yi Cao, founding partner of Source Code Capital, proposed the principle of "three overlapping waves" in his article The Nine Faces of Technological Innovation:
Usually, while the impact of the first wave of technology-driven change is still building momentum, a second major wave has already risen, and sometimes even a third wave is gathering force. The most typical example is China's retail industry in 2008: in the first wave, traditional retailers were continuously improving efficiency through technological means; the second wave saw chains like Suning and Gome pursuing national expansion through "technologization," "chain-ification," and mergers and acquisitions. Everyone was enjoying growth of several tens of percent. Although they also saw the rise of e-commerce represented by Taobao in the third wave, they mistakenly believed they had already reached great heights, while e-commerce's volume was too small to pose a threat... The final result was, as the Yangtze's waves drive on those before, the earlier waves died in their comfort zone.
Retail is no isolated case. If you care to trace back through past Gartner curves, you'll find more intriguing examples.
In 2003, Gartner listed MP3 players on its consumer emerging technology curve as a technology about to emerge from the trough and achieve widespread application. By 2007, this technology had indeed reached the plateau of productivity as predicted. But in that same year, another technology quietly climbed onto the radar. Initially called Ultramobile Devices, it evolved into ultrabooks, tablets, and eventually the all-powerful smartphones of today. The MP3 player market gradually eroded under this new technology's encroachment, so that today it exists mainly as a sub-function of portable devices.
A similar story played out with Video on Demand. In 2003, Gartner believed this technology needed at least 5-10 more years to mature. But by 2007, it was already seeing the dawn of commercial use, with people even beginning to imagine faster and better broadband video-on-demand. Yet no one expected that a decade later, the most prevalent form would be mobile TV streaming — dismissed at the time — rather than the vaunted broadband solution.
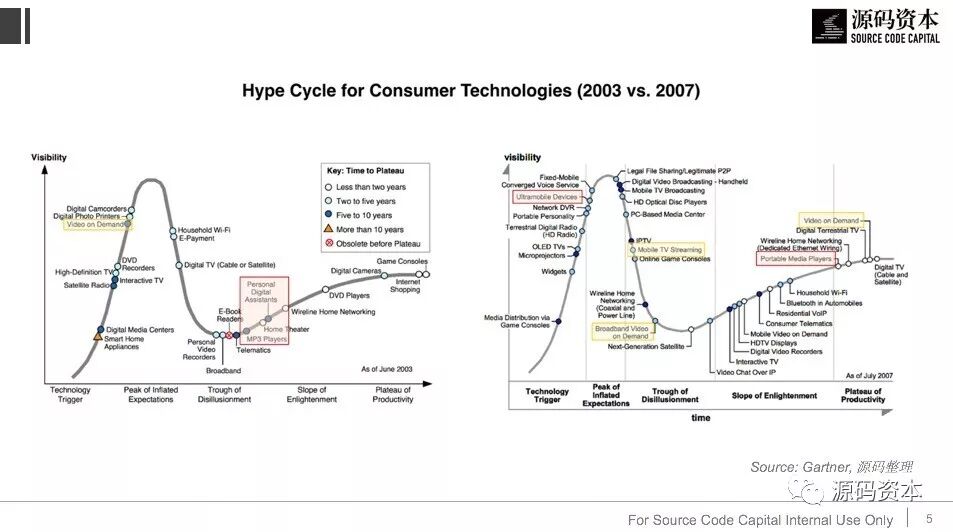
I don't mean to create a "new technology above all" misconception, only to remind accomplished explorers to maintain sufficient sensitivity to change and to update their mental models constantly. First-mover advantage in technology doesn't always guarantee an impregnable business model. It should rather be viewed as an ecological chain: the mantis stalks the cicada, unaware of the oriole behind. All technological species must evolve and iterate continuously to ensure even temporary safety.
4
The Dilemma of the Clear-Eyed
In closing, I want to return once more to that summer when the internet bubble burst.
In 2000, Forbes magazine sent inquiries about investment returns to 550 VC firms. Among them, Accel Partners' Fund V at 21.6x and Charles River Ventures at 16.8x still dazzle today (years later, Accel invested in Facebook, CRV in Twitter, but neither matched this benchmark in the same period).
Yet even these two star VCs paled before Crosspoint Venture Partners. Crosspoint's 1996 fund returned 33.7x — meaning an LP who invested $1 four years earlier had already gotten back $29.60, with $4.10 still in the account. So even as secondary markets began avalanching, Crosspoint smoothly raised a mega-fund of $850 million for a single vintage.
Yet at year's end, Crosspoint suddenly announced it would return the entire fund to LPs and indefinitely suspend fundraising for its next fund. This sent shockwaves through the industry. Partner Rich Shapero had to explain to the outside world: "The collapse of the secondary market has invalidated all our past prediction models... If market prosperity never returns, we can't deliver the performance we want to deliver... We have a great history, and we don't want to ruin it... This is not a good time to invest in any company."
Excerpted from The Suicide of a Top-Tier VC by Yuan Liu, with modifications
"Not a good time to invest in any company." This line is especially thought-provoking.
In retrospect, the NASDAQ didn't reclaim the 3,000 level until 2012; 1999 and 2000 became the only two years of negative IRR in U.S. venture capital history. But from another angle, Crosspoint also missed LinkedIn, Skype, Facebook, Twitter, Airbnb, and WhatsApp — all founded in the twelve years that followed — while its old rivals NEA, CRV, Benchmark, and Sequoia persevered until these unicorns grew into towering trees.
One could say Crosspoint's judgment of the internet bubble and market decline was sober and accurate; it's just that this macro-level clarity didn't translate to micro-level good fortune. Venture capital is fundamentally a process of capturing "positive Black Swan events" — multiple trials with limited losses can always be offset by a single outsized gain. On Black Swan questions, what matters isn't the average but the extremes. It's like trying to cross a river that's 1 meter deep on average: the risk lies entirely in the deepest parts. Nassim Taleb, expert on Black Swan events, wrote years before the financial crisis to reveal risks in the financial system. His experience may offer some lessons:
- All knowledge derived from observation has traps. Seeing ten thousand white swans cannot prove black swans don't exist — this is the inherent limitation of inductive reasoning. On questions where losses are limited and gains unlimited, what you don't know matters more than what you know. Those who try to predict Black Swans through induction will mostly waste their efforts. Faced with uncertainty, you're more likely to gather evidence proving what's wrong than what's right. The value of falsification is perennially underestimated.
- People make two errors when using scientific models: first, inappropriate abstraction and simplification of problems, such as trying to summarize something with an 80/20 distribution using averages while ignoring variance; second, confirmation bias — complex systems are often full of imperceptible interdependencies and nonlinear relationships. If you only care about fine-tuning your understanding of ordinary events to fit new occurrences into old models, the models eventually become so complex they deviate from reality.
Taleb's points take some unpacking. What he reveals isn't "what can be done" but "what cannot be done." In his view, people undervalue knowledge that cannot be precisely described in language, over-trust models they construct, and are thus destined to fall into traps where models fail to match reality.
Whether it's the Gartner curve itself, Michael Mullany's retrospective on the curve, or Crosspoint's post-bubble-crash worldview, all are essentially partial silhouettes of a complex world from certain angles. Clarity about the local is necessary, but don't let local confidence blind you to the bigger picture. In the global view, what you don't know may play a more important role. Maintaining humility and continuously expanding cognitive boundaries can both help you better defend against risk and potentially position risk more favorably to your side.
5
One More Thing
In explaining the Gartner curve, I've deliberately avoided some technical details that might distract. If you're interested, the following Q&A can serve as footnotes and supplements to the above.
Q1: How is the Gartner curve drawn? Is there empirical research behind it?
A1: Many who cite it frequently don't know that this wave is actually the superposition of two curves. One is Hype Level, reflecting the inflated portion of media and public expectations for a technology. The other is engineering and commercial maturity. After superposition, the Y-axis corresponds to a technology's actual expectation, and the X-axis to the progression of time.
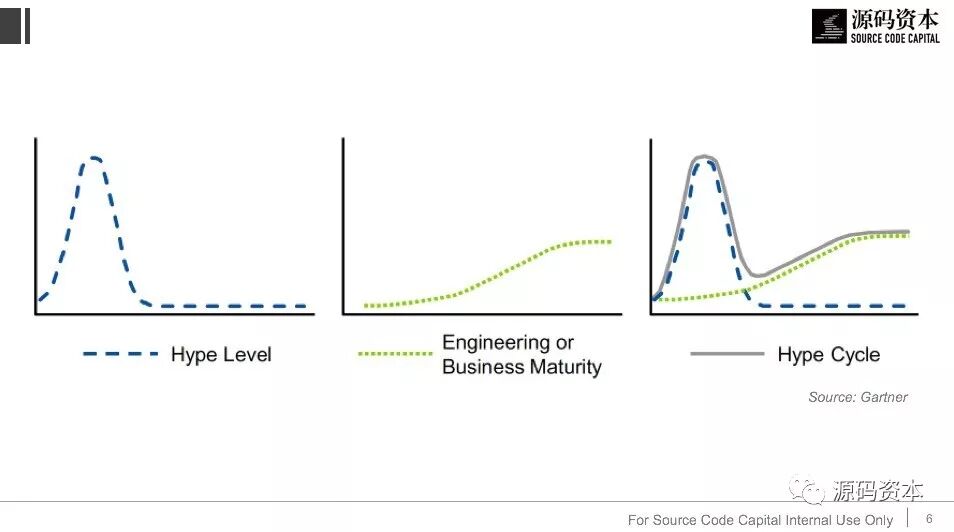
"Hype" literally means exaggerated promotion. When a technology breaks through, releases a demo, or launches a product, media typically follows quickly. Visions and rumors about technological prospects raise public interest. But as time progresses, objective analysis and trial-and-error accumulate, and the inflated components of promotion are gradually filtered out by the market — this is the internal logic of Hype Level's initial rise and subsequent fall. That a technology becomes increasingly mature in engineering and commerce over time also aligns with common sense.
Note that neither hype nor expectation (the Y-axis) currently has unified, recognized metrics for measurement; the same holds for technology maturity and commercial maturity. Gartner's team determines each technology's position on the curve through interviews with industry experts and practitioners, followed by analytical forecasting. Thus there is a certain subjectivity, and it's unsuitable for quantitative examination. Its value lies more in qualitatively revealing the degree of deviation between a technology's promise and reality.
Q2: Is there only this one curve shape? Are there variants?
A2: Far from it. Some technologies may undergo phoenix-like transformations: hyped at first appearance, then cooling as the technology proves immature, only to return to public view years later due to major advances in technology and product, sparking a new round of hype peaks. In such cases, the curve shows a "double-peak" shape, with the second peak sometimes even higher than the first. A classic example is Virtual Reality. Can you guess when it first appeared on the Gartner curve? The answer: 1995.
Beyond Hype Level, another dimension is Maturity. Technology doesn't always follow linear growth patterns; some technologies have markedly shorter maturation cycles than others. Reasons may include:
- Extremely simple to use, with low security risks, thus quickly expanding from B2C to B2B;
- High visibility and demonstrability, making viral spread likely when others use it;
- Coordinated push from upstream supply chain vendors, or the technology's ability to leverage existing infrastructure.
As shown in the left figure below, when a technology fortunately enters the fast lane of development, it likely won't show a pronounced trough, instead moving directly from rationalized expectations to mature application. Conversely, some technologies may experience troughs lasting decades, because underlying scientific research progresses far more slowly than anticipated — artificial intelligence and nanocomputing are examples.
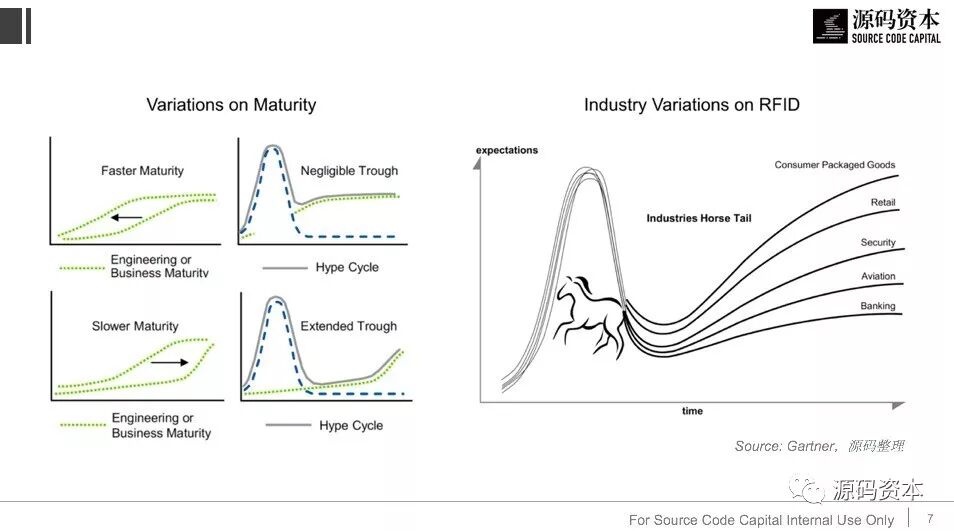
Another variant is the "comet tail effect," where a technology matures in engineering but sees markedly different fates across industries. The right figure above gives RFID as an example. This technology was once highly anticipated across industries in the mid-1990s, but ultimately found widespread application mainly in fast-moving consumer goods and retail, while early attempts at airline cargo sorting failed.
Spatial and temporal differences are also worth considering. A technology may occupy different positions in different countries or regions, but follow similar development paths. The experience accumulated by pioneers through trial-and-error can both illuminate the way for latecomers and accelerate that technology's maturation in later-developing regions, creating spatial arbitrage opportunities. This resonates with Masayoshi Son's often-cited "time machine" theory — first developing business in developed countries like the United States to validate the model, then leveraging experiential advantage to re-enter Japan and China when timing is ripe.
More Source Code Capital Internal References
Issue 6: Industrial Internet Investment Landscape
Issue 5: Convenience Stores: Where Does China's 7-Eleven Go Under the New Retail Wind?
Issue 4: Mobile Going Global: Entrepreneurs Eye Big Opportunities in Content Products
Issue 3: Targeting Unicorns in the Consumer Upgrade Wave
Issue 2: Profile of "Reliable" AI Startup Characteristics
Issue 1: Under "New Retail," Where Do Offline Stores Go?

Create Enduring Real Value
Long-press to scan QR code and follow Source Code Capital